
Page 104 - Colleyville FY21 Budget
P. 104
Center (EOC), monitoring incident activities and progress. Cost recovery efforts for EOC
disaster operations is also an important function. Day to day activities for the Coordinator
often include monitoring storm warnings, potential public health issues and Code Red
activations to warn residents of specific public safety issues.
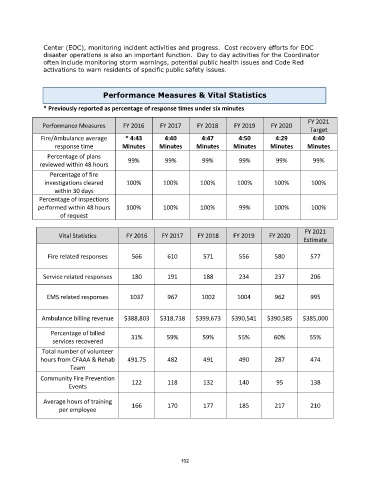
Performance Measures & Vital Statistics
* Previously reported as percentage of response times under six minutes
FY 2021
Performance Measures FY 2016 FY 2017 FY 2018 FY 2019 FY 2020
Target
Fire/Ambulance average * 4:43 4:40 4:47 4:50 4:29 4:40
response time Minutes Minutes Minutes Minutes Minutes Minutes
Percentage of plans
reviewed within 48 hours 99% 99% 99% 99% 99% 99%
Percentage of fire
investigations cleared 100% 100% 100% 100% 100% 100%
within 30 days
Percentage of inspections
performed within 48 hours 100% 100% 100% 99% 100% 100%
of request
FY 2021
Vital Statistics FY 2016 FY 2017 FY 2018 FY 2019 FY 2020
Estimate
Fire related responses 566 610 571 556 580 577
Service related responses 180 191 188 234 237 206
EMS related responses 1037 967 1002 1004 962 995
Ambulance billing revenue $388,803 $318,738 $399,673 $390,541 $390,585 $385,000
Percentage of billed
services recovered 31% 59% 59% 55% 60% 55%
Total number of volunteer
hours from CFAAA & Rehab 491.75 482 491 490 287 474
Team
Community Fire Prevention 122 118 132 140 95 138
Events
Average hours of training 166 170 177 185 217 210
per employee
102