
Page 109 - Benbrook FY2021
P. 109
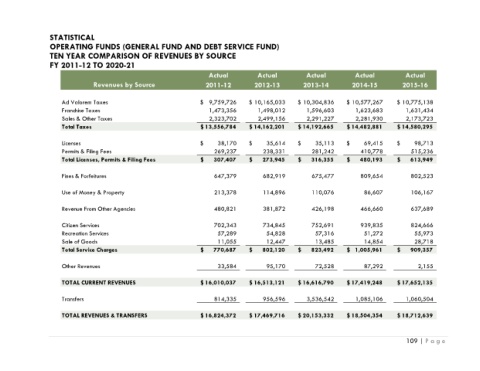
STATISTICAL
                 OPERATING FUNDS (GENERAL FUND AND DEBT SERVICE FUND)
                 TEN YEAR COMPARISON OF REVENUES BY SOURCE
                 FY 2011-12 TO 2020-21

                                                                      Actual          Actual          Actual          Actual           Actual
                                Revenues by Source                   2011-12         2012-13         2013-14         2014-15          2015-16

                     Ad Valorem Taxes                              $     9,759,726  $   10,165,033  $   10,304,836  $   10,577,267  $   10,775,138
                     Franchise Taxes                                  1,473,356       1,498,012       1,596,603       1,623,683        1,631,434
                     Sales & Other Taxes                              2,323,702       2,499,156       2,291,227       2,281,930        2,173,723
                     Total Taxes                                   $  13,556,784    $  14,162,201    $  14,192,665    $  14,482,881  $  14,580,295


                     Licenses                                      $           38,170  $           35,614  $           35,113  $           69,415  $           98,713
                     Permits & Filing Fees                              269,237         238,331         281,242         410,778          515,236
                     Total Licenses, Permits & Filing Fees         $        307,407  $        273,945  $        316,355  $        480,193  $        613,949


                     Fines & Forfeitures                                647,379         682,919         675,477         809,654          802,523

                     Use of Money & Property                            213,378         114,896         110,076          86,607          106,167

                     Revenue From Other Agencies                        480,821         381,872         426,198         466,660          637,689


                     Citizen Services                                   702,343         734,845         752,691         939,835          824,666
                     Recreation Services                                 57,289          54,828          57,316          51,272           55,973
                     Sale of Goods                                       11,055          12,447          13,485          14,854           28,718
                     Total Service Charges                         $        770,687  $        802,120  $        823,492  $     1,005,961  $        909,357

                     Other Revenues                                      33,584          95,170          72,528          87,292            2,155


                     TOTAL CURRENT REVENUES                        $  16,010,037   $  16,513,121   $  16,616,790   $  17,419,248    $  17,652,135

                     Transfers                                          814,335         956,596       3,536,542       1,085,106        1,060,504

                     TOTAL REVENUES & TRANSFERS                    $  16,824,372   $  17,469,716   $  20,153,332   $  18,504,354    $  18,712,639


                                                                                                                                       109 | P a g e