
Page 110 - Benbrook FY2021
P. 110
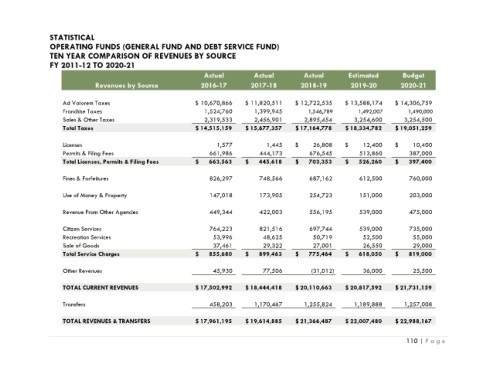
STATISTICAL
                 OPERATING FUNDS (GENERAL FUND AND DEBT SERVICE FUND)
                 TEN YEAR COMPARISON OF REVENUES BY SOURCE
                 FY 2011-12 TO 2020-21

                                                                    Actual           Actual          Actual         Estimated         Budget
                                Revenues by Source                 2016-17          2017-18         2018-19          2019-20         2020-21

                      Ad Valorem Taxes                           $   10,670,866   $   11,820,511  $   12,722,535   $   13,588,174   $   14,306,759
                      Franchise Taxes                               1,524,760        1,399,945         1,546,789       1,492,007        1,490,000
                      Sales & Other Taxes                           2,319,533        2,456,901       2,895,454        3,254,600       3,254,500
                      Total Taxes                                 $  14,515,159    $  15,677,357   $  17,164,778   $  18,334,782   $  19,051,259

                      Licenses                                           1,577           1,445    $           26,808  $           12,400  $           10,400
                      Permits & Filing Fees                           661,986          444,173         676,545          513,860         387,000
                      Total Licenses, Permits & Filing Fees       $        663,563  $        445,618  $        703,353  $        526,260  $        397,400

                      Fines & Forfeitures                             826,297          748,566         687,162          612,500         760,000

                      Use of Money & Property                         147,018          173,905         254,723          151,000         203,000

                      Revenue From Other Agencies                     449,344          422,003         556,195          539,000         475,000

                      Citizen Services                                764,223          821,516         697,744          539,000         735,000
                      Recreation Services                              53,996           48,625          50,719           52,500          55,000
                      Sale of Goods                                    37,461           29,322          27,001           26,550          29,000
                      Total Service Charges                       $        855,680  $        899,463  $        775,464  $        618,050  $        819,000

                      Other Revenues                                   45,930           77,506          (31,012)         36,000          25,500


                      TOTAL CURRENT REVENUES                      $  17,502,992   $  18,444,418    $  20,110,663   $  20,817,592   $  21,731,159

                      Transfers                                       458,203        1,170,467       1,255,824        1,189,888       1,257,008


                      TOTAL REVENUES & TRANSFERS                  $  17,961,195   $  19,614,885    $  21,366,487   $  22,007,480   $  22,988,167


                                                                                                                                       110 | P a g e