
Page 329 - City of Bedford FY21 Budget
P. 329
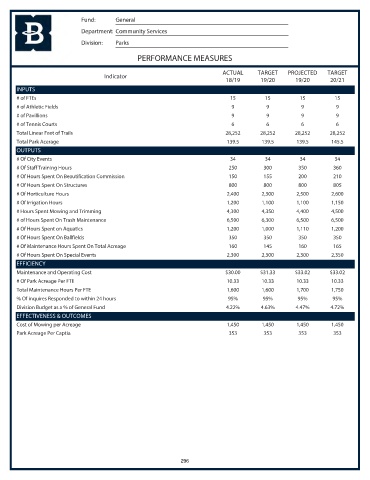
Fund:      General
                            Department: Community Services
                            Division:  Parks

                                               PERFORMANCE MEASURES

                                                                           ACTUAL     TARGET    PROJECTED    TARGET
                                    Indicator
                                                                            18/19      19/20       19/20      20/21
       INPUTS
       # of FTEs                                                             15          15         15          15
       # of Athletic Fields                                                   9          9           9          9
       # of Pavillions                                                        9          9           9          9
       # of Tennis Courts                                                     6          6           6          6
       Total Linear Feet of Trails                                          28,252     28,252      28,252     28,252
       Total Park Acerage                                                   139.5       139.5      139.5       145.5
       OUTPUTS
       # Of City Events                                                      34          34         34          34
       # Of Staff Training Hours                                             250        300         350        360
       # Of Hours Spent On Beautification Commission                         150        155         200        210
       # Of Hours Spent On Structures                                        800        800         800        805
       # Of Horticulture Hours                                              2,400       2,300      2,500       2,600
       # Of Irrigation Hours                                                1,200       1,100      1,100       1,150
       # Hours Spent Mowing and Trimming                                    4,300       4,350      4,400       4,500
       # of Hours Spent On Trash Maintenance                                6,500       6,300      6,500       6,500
       # Of Hours Spent on Aquatics                                         1,200       1,000      1,110       1,200
       # Of Hours Spent On Ballfields                                        350        350         350        350
       # Of Maintenance Hours Spent On Total Acreage                         160        145         160        165
       # Of Hours Spent On Special Events                                   2,300       2,300      2,300       2,350
       EFFICIENCY
       Maintenance and Operating Cost                                       $30.00     $31.33      $33.02     $33.02
       # Of Park Acreage Per FTE                                            10.33       10.33      10.33       10.33
       Total Maintenance Hours Per FTE                                      1,600       1,600      1,700       1,750
       % Of inquires Responded to within 24 hours                           95%         95%         95%        95%
       Division Budget as a % of General Fund                               4.22%      4.63%       4.47%      4.72%
       EFFECTIVENESS & OUTCOMES
       Cost of Mowing per Acreage                                           1,450       1,450      1,450       1,450
       Park Acreage Per Captia                                               353        353         353        353


                                                             296