
Page 325 - City of Bedford FY21 Budget
P. 325
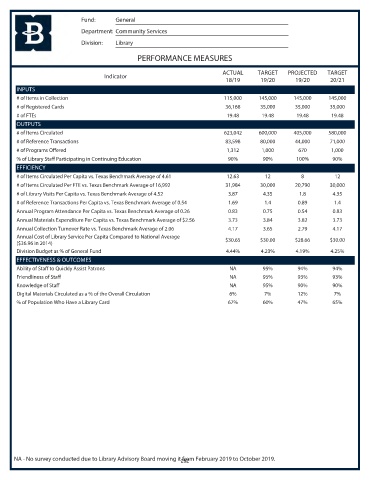
Fund:      General
                            Department: Community Services
                            Division:  Library

                                               PERFORMANCE MEASURES

                                                                           ACTUAL     TARGET    PROJECTED    TARGET
                                    Indicator
                                                                            18/19      19/20       19/20      20/21
       INPUTS
       # of Items in Collection                                            115,000     145,000    145,000     145,000
       # of Registered Cards                                                36,168     35,000      35,000     35,000
       # of FTEs                                                            19.48       19.48      19.48       19.48
       OUTPUTS
       # of Items Circulated                                               623,042     600,000    405,000     580,000
       # of Reference Transactions                                          83,598     80,000      44,000     71,000
       # of Programs Offered                                                1,312       1,000       670        1,000
       % of Library Staff Participating in Continuing Education             90%         90%        100%        90%
       EFFICIENCY
       # of Items Circulated Per Capita vs. Texas Benchmark Average of 4.61  12.63       12          8          12
       # of Items Circulated Per FTE vs. Texas Benchmark Average of 16,992  31,984     30,000      20,790     30,000
       # of Library Visits Per Capita vs. Texas Benchmark Average of 4.52    3.87       4.35        1.8        4.35
       # of Reference Transactions Per Capita vs. Texas Benchmark Average of 0.54  1.69  1.4        0.89        1.4
       Annual Program Attendance Per Capita vs. Texas Benchmark Average of 0.26  0.83   0.75        0.54       0.83
       Annual Materials Expenditure Per Capita vs. Texas Benchmark Average of $2.56  3.73  3.84     3.82       3.73
       Annual Collection Turnover Rate vs. Texas Benchmark Average of 2.06   4.17       3.65        2.79       4.17
       Annual Cost of Library Service Per Capita Compared to National Average
                                                                            $30.65     $30.00      $28.66     $30.00
       ($36.96 in 2014)
       Division Budget as % of General Fund                                 4.44%      4.23%       4.19%      4.25%
       EFFECTIVENESS & OUTCOMES
       Ability of Staff to Quickly Assist Patrons                            NA         95%         94%        94%
       Friendliness of Staff                                                 NA         95%         93%        93%
       Knowledge of Staff                                                    NA         95%        90%         90%
       Digital Materials Circulated as a % of the Overall Circulation        6%         7%          12%        7%
       % of Population Who Have a Library Card                              67%         60%         47%        65%


      NA - No survey conducted due to Library Advisory Board moving it from February 2019 to October 2019.
                                                             292