
Page 466 - FY 2009 Proposed Budget
P. 466
Public Safety
Goal 1: Utilize Targeted Initiatives and Industry
Best Practices and Policies to Foster a Safe Environment
Objective 1: Improve Quality of Life and Place
Project Performance Measure(s) City Service Team (Department)
Core Traffic Safety Injury Crashes Neighborhood Services (Police)
PS DWI Crashes
1.1.2 CMV Inspections
Summary:
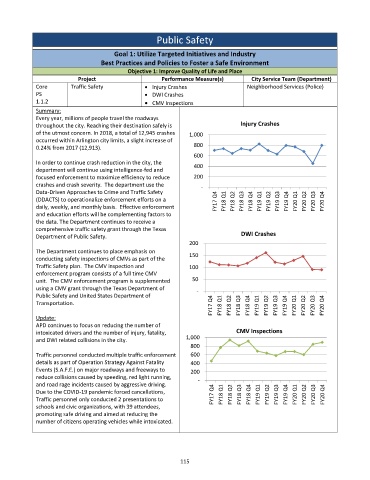
Every year, millions of people travel the roadways
throughout the city. Reaching their destination safely is Injury Crashes
of the utmost concern. In 2018, a total of 12,945 crashes 1,000
occurred within Arlington city limits, a slight increase of
0.24% from 2017 (12,913). 800
600
In order to continue crash reduction in the city, the
400
department will continue using intelligence‐fed and
focused enforcement to maximize efficiency to reduce 200
crashes and crash severity. The department use the ‐
Data‐Driven Approaches to Crime and Traffic Safety
(DDACTS) to operationalize enforcement efforts on a FY17 Q4 FY18 Q1 FY18 Q2 FY18 Q3 FY18 Q4 FY19 Q1 FY19 Q2 FY19 Q3 FY19 Q4 FY20 Q1 FY20 Q2 FY20 Q3 FY20 Q4
daily, weekly, and monthly basis. Effective enforcement
and education efforts will be complementing factors to
the data. The Department continues to receive a
comprehensive traffic safety grant through the Texas
Department of Public Safety. DWI Crashes
200
The Department continues to place emphasis on
150
conducting safety inspections of CMVs as part of the
Traffic Safety plan. The CMV inspection and 100
enforcement program consists of a full time CMV
unit. The CMV enforcement program is supplemented 50
using a CMV grant through the Texas Department of ‐
Public Safety and United States Department of
Transportation. FY17 Q4 FY18 Q1 FY18 Q2 FY18 Q3 FY18 Q4 FY19 Q1 FY19 Q2 FY19 Q3 FY19 Q4 FY20 Q1 FY20 Q2 FY20 Q3 FY20 Q4
Update:
APD continues to focus on reducing the number of
intoxicated drivers and the number of injury, fatality, CMV Inspections
and DWI related collisions in the city. 1,000
800
Traffic personnel conducted multiple traffic enforcement 600
details as part of Operation Strategy Against Fatality 400
Events (S.A.F.E.) on major roadways and freeways to 200
reduce collisions caused by speeding, red light running, ‐
and road rage incidents caused by aggressive driving.
Due to the COVID‐19 pandemic forced cancellations, FY17 Q4 FY18 Q1 FY18 Q2 FY18 Q3 FY18 Q4 FY19 Q1 FY19 Q2 FY19 Q3 FY19 Q4 FY20 Q1 FY20 Q2 FY20 Q3 FY20 Q4
Traffic personnel only conducted 2 presentations to
schools and civic organizations, with 39 attendees,
promoting safe driving and aimed at reducing the
number of citizens operating vehicles while intoxicated.
115