
Page 217 - City of Westlake FY20 Budget
P. 217
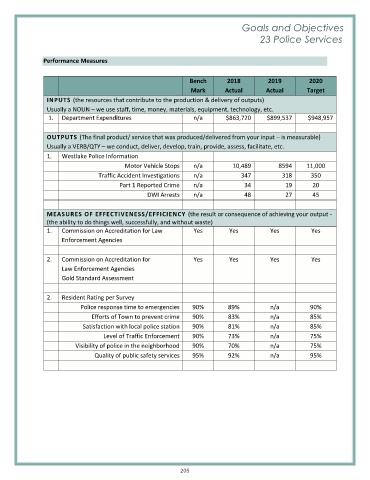
Goals and Objectives

                                                                                          23 Police Services


               Performance Measures

                                                                Bench       2018          2019         2020

                                                                Mark       Actual        Actual        Target
                 INPUTS (the resources that contribute to the production & delivery of outputs)
                 Usually a NOUN – we use staff, time, money, materials, equipment, technology, etc.
                 1.   Department Expenditures                    n/a        $863,720     $899,537      $948,957

                 OUTPUTS (The final product/ service that was produced/delivered from your input – is measurable)
                 Usually a VERB/QTY – we conduct, deliver, develop, train, provide, assess, facilitate, etc.

                 1.   Westlake Police Information
                                          Motor Vehicle Stops    n/a          10,489         8594     11,000
                                  Traffic Accident Investigations   n/a          347          318       350
                                         Part 1 Reported Crime   n/a              34           19       20
                                                  DWI Arrests    n/a              48           27       45

                 MEASURES OF EFFECTIVENESS/EFFICIENCY (the result or consequence of achieving your output -
                 (the ability to do things well, successfully, and without waste)
                 1.   Commission on Accreditation for Law        Yes         Yes          Yes           Yes
                     Enforcement Agencies

                 2.   Commission on Accreditation for            Yes         Yes          Yes           Yes
                     Law Enforcement Agencies
                     Gold Standard Assessment

                 2.   Resident Rating per Survey
                            Police response time to emergencies   90%       89%           n/a           90%
                               Efforts of Town to prevent crime   90%       83%           n/a           85%
                            Satisfaction with local police station   90%    81%           n/a           85%
                                   Level of Traffic Enforcement   90%       73%           n/a           75%
                          Visibility of police in the neighborhood   90%    70%           n/a           75%
                                Quality of public safety services   95%     92%           n/a           95%


                                                             205