
Page 19 - Pantego Adopted Budget FY20
P. 19
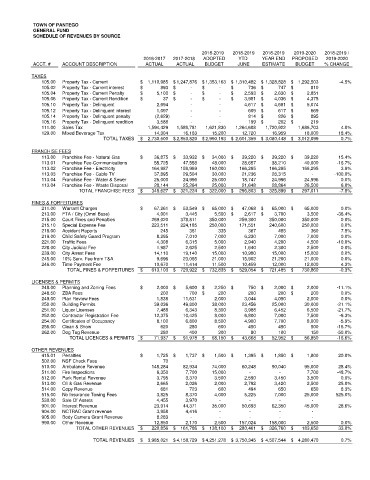
TOWN OF PANTEGO
GENERAL FUND
SCHEDULE OF REVENUES BY SOURCE
2018-2019 2018-2019 2018-2019 2019-2020 2018-2019 /
2016-2017 2017-2018 ADOPTED YTD YEAR END PROPOSED 2019-2020
ACCT. # ACCOUNT DESCRIPTION ACTUAL ACTUAL BUDGET JUNE ESTIMATE BUDGET % CHANGE
TAXES
105.00 Property Tax - Current $ 1,110,985 $ 1,247,876 $ 1,353,163 $ 1,310,482 $ 1,328,828 $ 1,292,503 -4.5%
105.02 Property Tax - Current interest $ 893 $ - $ - $ 736 $ 747 $ 810
105.04 Property Tax - Current Penalty $ 5,100 $ - $ - $ 2,593 $ 2,630 $ 2,851
105.06 Property Tax - Current Rendition $ 37 $ - $ - $ 3,981 $ 4,036 $ 4,375
105.10 Property Tax - Delinquent 2,694 - - 4,617 $ 4,681 $ 5,074
105.12 Property Tax - Delinquent interest 1,097 - - 609 $ 617 $ 669
105.14 Property Tax - Delinquent penalty (2,629) - - 814 $ 826 $ 895
105.16 Property Tax - Delinquent rendition 3,588 - - 199 $ 202 $ 219
111.00 Sales Tax 1,594,429 1,589,781 1,621,830 1,264,608 1,720,922 1,686,703 4.0%
129.00 Mixed Beverage Tax 14,304 16,163 15,200 12,720 16,959 18,000 18.4%
TOTAL TAXES $ 2,730,500 $ 2,853,820 $ 2,990,193 $ 2,601,359 $ 3,080,448 $ 3,012,099 0.7%
FRANCHISE FEES
113.00 Franchise Fee - Natural Gas $ 36,875 $ 33,932 $ 34,000 $ 39,220 $ 39,220 $ 39,220 15.4%
113.01 Franchise Fee-Communications 55,725 47,558 48,000 28,657 38,210 40,000 -16.7%
113.02 Franchise Fee - Electricity 164,987 159,969 160,000 166,295 166,295 166,295 3.9%
113.03 Franchise Fee - Cable TV 37,895 29,504 30,000 21,236 28,315 - -100.0%
113.04 Franchise Fee - Water & Sewer 25,000 24,996 25,000 18,747 24,996 24,996 0.0%
113.04 Franchise Fee - Waste Disposal 28,144 25,264 25,000 21,648 28,864 26,500 6.0%
TOTAL FRANCHISE FEES $ 348,627 $ 321,224 $ 322,000 $ 295,803 $ 325,899 $ 297,011 -7.8%
FINES & FORFEITURES
211.00 Warrant Charges $ 67,261 $ 53,549 $ 65,000 $ 47,068 $ 65,000 $ 65,000 0.0%
213.00 FTA / City (Omni Base) 4,001 3,445 5,500 $ 2,617 $ 3,700 3,500 -36.4%
215.00 Court Fines and Penalties 269,020 378,811 350,000 259,300 350,000 350,000 0.0%
215.10 Special Expense Fee 223,511 224,185 250,000 171,551 240,600 250,000 0.0%
216.00 Accident Reports 245 361 335 367 485 360 7.5%
219.00 Child Safety Guard Program 8,295 7,010 7,000 6,230 7,000 7,000 0.0%
221.00 Traffic Fees 4,308 6,315 5,000 2,940 4,200 4,500 -10.0%
228.00 City Judicial Fee 1,987 2,625 2,500 1,640 2,300 2,500 0.0%
239.00 City Arrest Fees 14,110 19,140 15,000 10,980 15,000 15,000 0.0%
245.00 10% Serv. Fee from T&A 9,696 23,065 21,000 15,902 21,200 21,000 0.0%
246.00 Time Payment Fee 10,670 11,414 11,500 10,459 12,000 12,000 4.3%
TOTAL FINES & FORFEITURES $ 613,103 $ 729,922 $ 732,835 $ 529,054 $ 721,485 $ 730,860 -0.3%
LICENSES & PERMITS
248.00 Planning and Zoning Fees $ 2,000 $ 5,600 $ 2,250 $ 750 $ 2,000 $ 2,000 -11.1%
248.50 ZBA Fees 200 700 $ 200 200 200 $ 200 0.0%
249.00 Plan Review Fees 1,838 11,631 2,000 3,044 4,050 2,000 0.0%
250.00 Building Permits 39,036 49,800 38,000 23,456 25,000 30,000 -21.1%
251.00 Liquor Licenses 7,488 6,343 8,300 3,988 6,452 6,500 -21.7%
252.00 Contractor Registration Fee 12,375 10,425 8,000 6,800 7,000 7,500 -6.3%
254.00 Certificates of Occupancy 8,100 6,800 8,500 4,900 7,700 8,000 -5.9%
256.00 Clean & Show 620 280 600 450 450 500 -16.7%
262.00 Dog Tag Revenue 280 400 300 80 100 150 -50.0%
TOTAL LICENCES & PERMITS $ 71,937 $ 91,978 $ 68,150 $ 43,668 $ 52,952 $ 56,850 -16.6%
OTHER REVENUES
415.01 Penalties $ 1,725 $ 1,737 $ 1,500 $ 1,395 $ 1,850 $ 1,800 20.0%
502.00 NSF Check Fees 70 - - - - -
510.00 Ambulance Revenue 148,284 82,934 74,000 60,248 90,040 95,000 28.4%
511.00 Fire Inspections 6,350 7,700 15,000 - - 7,700 -48.7%
512.00 Park Rental Revenue 3,795 3,370 3,500 2,590 3,450 3,500 0.0%
513.00 Oil & Gas Revenue 2,665 2,026 2,000 2,792 3,420 2,500 25.0%
514.00 Copy Revenue 681 723 600 494 650 650 8.3%
515.00 No Insurance Towing Fees 3,825 8,370 4,000 5,225 7,000 25,000 525.0%
530.00 Sale Of Assets 4,455 3,970 - - - -
901.00 Interest Revenue 23,914 44,371 35,000 50,693 62,350 45,000 28.6%
904.00 NCTRAC Grant revenue 3,958 4,416 - - - -
905.00 Body Camera Grant Revenue 8,283 - - - - -
990.00 Other Revenue 12,850 2,170 2,500 157,024 158,000 2,500 0.0%
TOTAL OTHER REVENUES $ 220,856 $ 161,786 $ 138,100 $ 280,461 $ 326,760 $ 183,650 33.0%
TOTAL REVENUES $ 3,985,021 $ 4,158,729 $ 4,251,278 $ 3,750,345 $ 4,507,544 $ 4,280,470 0.7%