
Page 45 - NRH FY20 Approved Budget
P. 45
BUDGET OVERVIEW
FY 2018/2019 REVISED & FY 2019/2020 ADOPTED BUDGET
HIGHLIGHTS
As part of the regular annual budget process, some areas of the FY 2018/2019 budget
require revision from the originally adopted level. Projecting revenues and expenditures can be
difficult because they are being predicted up to fourteen months before they occur. Revenues
and expenditures are tracked throughout the year and adjustments are made to the Adopted
Budget in order to complete the fiscal year.
General Fund FY 2018/2019 Revised Budget
Revenue Overview
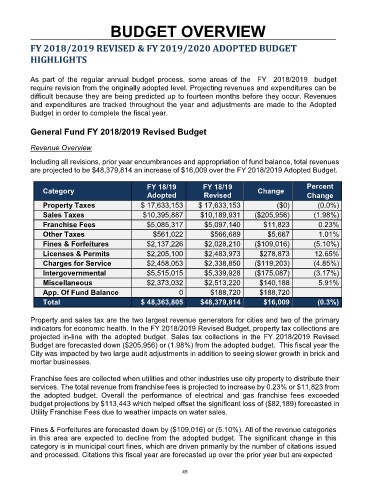
Including all revisions, prior year encumbrances and appropriation of fund balance, total revenues
are projected to be $48,379,814 an increase of $16,009 over the FY 2018/2019 Adopted Budget.
FY 18/19 FY 18/19 Percent
Category Change
Adopted Revised Change
Property Taxes $ 17,633,153 $ 17,633,153 ($0) (0.0%)
Sales Taxes $10,395,887 $10,189,931 ($205,956) (1.98%)
Franchise Fees $5,085,317 $5,097,140 $11,823 0.23%
Other Taxes $561,022 $566,689 $5,667 1.01%
Fines & Forfeitures $2,137,226 $2,028,210 ($109,016) (5.10%)
Licenses & Permits $2,205,100 $2,483,973 $278,873 12.65%
Charges for Service $2,458,053 $2,338,850 ($119,203) (4.85%)
Intergovernmental $5,515,015 $5,339,928 ($175,087) (3.17%)
Miscellaneous $2,373,032 $2,513,220 $140,188 5.91%
App. Of Fund Balance 0 $188,720 $188,720
Total $ 48,363,805 $48,379,814 $16,009 (0.3%)
Property and sales tax are the two largest revenue generators for cities and two of the primary
indicators for economic health. In the FY 2018/2019 Revised Budget, property tax collections are
projected in-line with the adopted budget. Sales tax collections in the FY 2018/2019 Revised
Budget are forecasted down ($205,956) or (1.98%) from the adopted budget. This fiscal year the
City was impacted by two large audit adjustments in addition to seeing slower growth in brick and
mortar businesses.
Franchise fees are collected when utilities and other industries use city property to distribute their
services. The total revenue from franchise fees is projected to increase by 0.23% or $11,823 from
the adopted budget. Overall the performance of electrical and gas franchise fees exceeded
budget projections by $113,443 which helped offset the significant loss of ($82,189) forecasted in
Utility Franchise Fees due to weather impacts on water sales.
Fines & Forfeitures are forecasted down by ($109,016) or (5.10%). All of the revenue categories
in this area are expected to decline from the adopted budget. The significant change in this
category is in municipal court fines, which are driven primarily by the number of citations issued
and processed. Citations this fiscal year are forecasted up over the prior year but are expected
45