Page 64 - Mansfieldr FY20 Approved Budget
P. 64

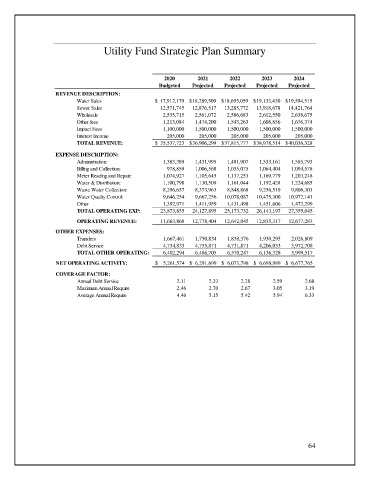
Utility Fund Strategic Plan Summary


                                                       2020       2021       2022       2023      2024
                                                      Budgeted   Projected  Projected  Projected  Projected
                   REVENUE DESCRIPTION:
                          Water Sales               $    17,912,179 $  18,289,509 $  18,695,059 $  19,133,430 $  19,594,515
                          Sewer Sales                     12,571,745     12,876,517     13,285,772     13,918,678     14,421,764
                          Wholesale                         2,535,715       2,561,072       2,586,683       2,612,550       2,638,675
                          Other fees                        1,213,084       1,474,200       1,543,263       1,608,856       1,676,374
                          Impact Fees                       1,100,000       1,500,000       1,500,000       1,500,000       1,500,000
                          Interest Income                      205,000          205,000          205,000          205,000          205,000
                          TOTAL REVENUE:            $    35,537,723 $  36,906,299 $  37,815,777 $  38,978,514 $  40,036,328
                   EXPENSE DESCRIPTION:
                          Administration:                   1,383,389       1,431,995       1,481,907       1,533,161       1,585,793
                          Billing and Collection:              978,859       1,006,568       1,035,075       1,064,404       1,094,578
                          Meter Reading and Repair:          1,074,927       1,105,645       1,137,253       1,169,779       1,203,248
                          Water & Distribution:             1,100,798       1,130,509       1,161,044       1,192,428       1,224,685
                          Waste Water Collection:           8,296,657       8,373,963       8,848,868       9,256,519       9,806,301
                          Water Quality Control:            9,646,254       9,667,256     10,078,087     10,475,300     10,972,141
                          Other                             1,392,971       1,411,959       1,431,498       1,451,606       1,472,299
                          TOTAL OPERATING EXP:            23,873,855     24,127,895     25,173,732     26,143,197     27,359,045
                           OPERATING REVENUE:             11,663,868     12,778,404     12,642,045     12,835,317     12,677,283
                   OTHER EXPENSES:
                           Transfers                        1,667,461       1,750,834       1,838,376       1,930,295       2,026,809
                           Debt Service                     4,734,833       4,735,871       4,731,871       4,206,033       3,972,708
                           TOTAL OTHER OPERATING:           6,402,294       6,486,705       6,570,247       6,136,328       5,999,517

                   NET OPERATING ACTIVITY:          $      5,261,574 $    6,291,699 $    6,071,798 $    6,698,989 $    6,677,765
                   COVERAGE FACTOR:
                           Annual Debt Service              2.11      2.33       2.28      2.59       2.68
                           Maximum Annual Require           2.46      2.70       2.67      3.05       3.19
                           Average Annual Require           4.46      5.15       5.42      5.94       6.33


                                                                                                       64
   59   60   61   62   63   64   65   66   67   68   69