
Page 264 - Mansfieldr FY20 Approved Budget
P. 264
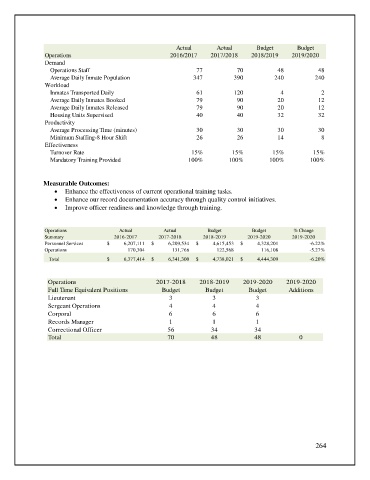
Actual        Actual       Budget       Budget
                Operations                               2016/2017     2017/2018    2018/2019     2019/2020
                Demand
                  Operations Staff                                77           70            48           48
                  Average Daily Inmate Population                347          390           240          240
                Workload
                  Inmates Transported Daily                       61          120             4            2
                  Average Daily Inmates Booked                    79           90            20           12
                  Average Daily Inmates Released                  79           90            20           12
                  Housing Units Supervised                        40           40            32           32
                Productivity
                  Average Processing Time (minutes)               30           30            30           30
                  Minimum Staffing-8 Hour Shift                   26           26            14            8
                Effectiveness
                  Turnover Rate                                 15%           15%          15%           15%
                  Mandatory Training Provided                  100%          100%         100%          100%


               Measurable Outcomes:
                   •  Enhance the effectiveness of current operational training tasks.
                   •  Enhance our record documentation accuracy through quality control initiatives.
                   •  Improve officer readiness and knowledge through training.


                Operations              Actual         Actual         Budget        Budget        % Change
                Summary                2016-2017     2017-2018      2018-2019      2019-2020      2019-2020
                Personnel Services  $              6,207,111  $              6,209,534  $               4,615,453  $               4,328,201  -6.22%
                Operations                               170,304                       131,766                      122,568                      116,108  -5.27%
                 Total              $              6,377,414  $              6,341,300  $              4,738,021  $               4,444,309  -6.20%


                 Operations                          2017-2018     2018-2019     2019-2020      2019-2020
                 Full Time Equivalent Positions        Budget        Budget        Budget        Additions
                 Lieutenant                              3             3              3
                 Sergeant Operations                     4             4              4
                 Corporal                                6             6              6
                 Records Manager                         1             1              1
                 Correctional Officer                   56             34            34
                 Total                                  70             48            48             0


                                                                                                         264