
Page 56 - Keller FY20 Approved Budget
P. 56
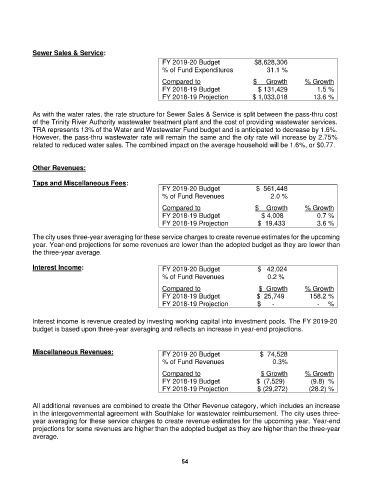
Sewer Sales & Service:
                                                       FY 2019-20 Budget               $8,628,306
                                                       % of Fund Expenditures            31.1 %

                                                       Compared to                   $     Growth     % Growth
                                                       FY 2018-19 Budget              $ 131,429           1.5 %
                                                       FY 2018-19 Projection         $ 1,033,018         13.6 %

            As with the water rates, the rate structure for Sewer Sales & Service is split between the pass-thru cost
            of the Trinity River Authority wastewater treatment plant and the cost of providing wastewater services.
            TRA represents 13% of the Water and Wastewater Fund budget and is anticipated to decrease by 1.6%.
            However, the pass-thru wastewater rate will remain the same and the city rate will increase by 2.75%
            related to reduced water sales. The combined impact on the average household will be 1.6%, or $0.77.


            Other Revenues:

            Taps and Miscellaneous Fees:
                                                       FY 2019-20 Budget              $  561,448
                                                       % of Fund Revenues                  2.0 %
                                                       Compared to                   $    Growth      % Growth
                                                       FY 2018-19 Budget                   $ 4,008             0.7 %
                                                       FY 2018-19 Projection             $  19,433        3.6 %

            The city uses three-year averaging for these service charges to create revenue estimates for the upcoming
            year. Year-end projections for some revenues are lower than the adopted budget as they are lower than
            the three-year average.

            Interest Income:                           FY 2019-20 Budget                 $   42,024
                                                       % of Fund Revenues                0.2 %

                                                       Compared to                     $  Growth      % Growth
                                                       FY 2018-19 Budget                $  25,749        158.2 %
                                                       FY 2018-19 Projection             $      -         -   %

            Interest income is revenue created by investing working capital into investment pools. The FY 2019-20
            budget is based upon three-year averaging and reflects an increase in year-end projections.


            Miscellaneous Revenues:                    FY 2019-20 Budget               $  74,528
                                                       % of Fund Revenues                  0.3%

                                                       Compared to                     $ Growth       % Growth
                                                       FY 2018-19 Budget                $  (7,529)       (9.8)  %
                                                       FY 2018-19 Projection            $ (29,272)     (28.2) %

            All additional revenues are combined to create the Other Revenue category, which includes an increase
            in the intergovernmental agreement with Southlake for wastewater reimbursement. The city uses three-
            year averaging for these service charges to create revenue estimates for the upcoming year. Year-end
            projections for some revenues are higher than the adopted budget as they are higher than the three-year
            average.


                                                             54