Page 65 - Grapevine FY20 Approved Budget
P. 65

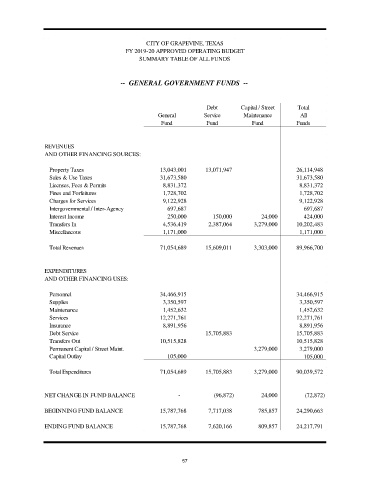
CITY OF GRAPEVINE, TEXAS
                                           FY 2019-20 APPROVED OPERATING BUDGET
                                               SUMMARY TABLE OF ALL FUNDS


                                         --  GENERAL GOVERNMENT FUNDS  --


                                                                     Debt        Capital / Street  Total
                                                     General         Service      Maintenance       All
                                                      Fund           Fund           Fund           Funds


                REVENUES
                AND OTHER FINANCING SOURCES:

                 Property Taxes                       13,043,001     13,071,947                    26,114,948
                 Sales & Use Taxes                    31,673,580                                   31,673,580
                 Licenses, Fees & Permits              8,831,372                                    8,831,372
                 Fines and Forfeitures                 1,728,702                                    1,728,702
                 Charges for Services                  9,122,928                                    9,122,928
                 Intergovernmental / Inter-Agency       697,687                                       697,687
                 Interest Income                        250,000        150,000         24,000         424,000
                 Transfers In                          4,536,419      2,387,064      3,279,000     10,202,483
                 Miscellaneous                         1,171,000                                    1,171,000

                 Total Revenues                       71,054,689     15,609,011      3,303,000     89,966,700


                EXPENDITURES
                AND OTHER FINANCING USES:

                 Personnel                            34,466,915                                   34,466,915
                 Supplies                              3,350,597                                    3,350,597
                 Maintenance                           1,452,632                                    1,452,632
                 Services                             12,271,761                                   12,271,761
                 Insurance                             8,891,956                                    8,891,956
                 Debt Service                                        15,705,883                    15,705,883
                 Transfers Out                        10,515,828                                   10,515,828
                 Permanent Capital / Street Maint.                                   3,279,000      3,279,000
                 Capital Outlay                         105,000                                       105,000

                 Total Expenditures                   71,054,689     15,705,883      3,279,000     90,039,572


                NET CHANGE IN FUND BALANCE                               -                  (96,872)                   24,000                 (72,872)

                BEGINNING FUND BALANCE                15,787,768      7,717,038       785,857      24,290,663

                ENDING FUND BALANCE                   15,787,768      7,620,166       809,857      24,217,791


                                                             57
   60   61   62   63   64   65   66   67   68   69   70