
Page 207 - Microsoft Word - FY 2020 Adopted Budget Document
P. 207
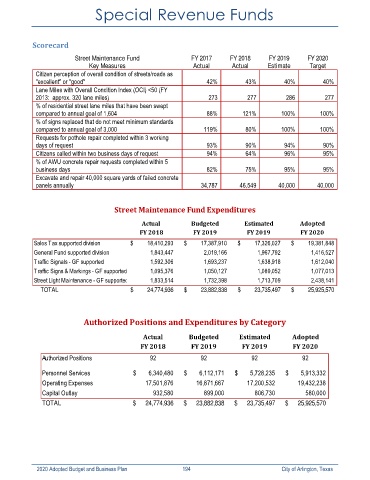
Special Revenue Funds


            Scorecard

                          Street Maintenance Fund               FY 2017      FY 2018      FY 2019      FY 2020
                              Key Measures                       Actual       Actual      Estimate     Target
             Citizen perception of overall condition of streets/roads as
             "excellent" or "good"                                   42%          43%          40%          40%
             Lane Miles with Overall Condition Index (OCI) <50 (FY
             2013:  approx. 320 lane miles)                           273          277          286          277
             % of residential street lane miles that have been swept
             compared to annual goal of 1,604                        88%         121%         100%         100%
             % of signs replaced that do not meet minimum standards
             compared to annual goal of 3,000                       119%          80%         100%         100%
             Requests for pothole repair completed within 3 working
             days of request                                         93%          90%          94%          90%
             Citizens called within two business days of request     94%          64%          96%          95%
             % of AWU concrete repair requests completed within 5
             business days                                           82%          75%          95%          95%
             Excavate and repair 40,000 square yards of failed concrete
             panels annually                                        34,787      46,549       40,000       40,000


                                       Street Maintenance Fund Expenditures

                                                Actual          Budgeted          Estimated         Adopted
                                               FY 2018           FY 2019           FY 2019          FY 2020
            Sales Tax supported division    $             18,410,293  $             17,387,910  $             17,326,027  $             19,381,848
            General Fund supported division                    1,843,447                    2,019,166                    1,967,792                    1,416,527
            Traffic Signals - GF supported                    1,592,306                    1,693,237                    1,638,918                    1,612,040
            Traffic Signs & Markings - GF supported                   1,095,376                    1,050,127                    1,089,052                    1,077,013
            Street Light Maintenance - GF supported                   1,833,514                    1,732,398                    1,713,709                    2,438,141
                 TOTAL                      $             24,774,936  $             23,882,838  $             23,735,497  $             25,925,570


                             Authorized Positions and Expenditures by Category


                                                Actual          Budgeted        Estimated         Adopted
                                               FY 2018          FY 2019          FY 2019          FY 2020
               Authorized Positions                92              92               92               92

               Personnel Services            $           6,340,480  $           6,112,171  $           5,728,235  $           5,913,332
               Operating Expenses                       17,501,876             16,871,667             17,200,532             19,432,238
               Capital Outlay                                 932,580                   899,000                   806,730                   580,000
               TOTAL                         $         24,774,936  $         23,882,838  $         23,735,497  $         25,925,570


             2020 Adopted Budget and Business Plan                                        194                                                                  City of Arlington, Texas