Page 87 - Ord 866 Adopting a revised Fiscal Year 17-18 and new proposed Fiscal Year 18-19 budget
P. 87

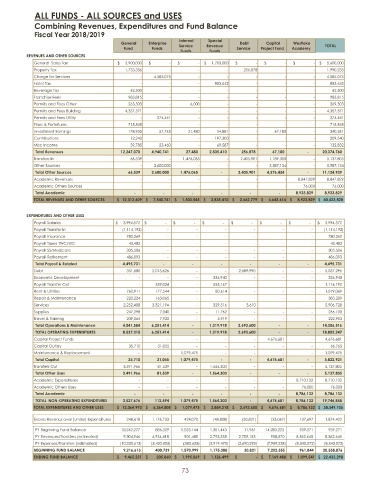
ALL FUNDS -  ALL SOURCES and USES
            Combining Revenues, Expenditures and Fund Balance
            Fiscal Year 2018/ 2019
                                                            Internal  Special
                                         General  Enterprise                    Debt     Capital  Westlake
                                                            Service  Revenue                                TOTAL
                                          Fund     Funds                       Service  Project Fund  Academy
                                                             Funds    Funds
          REVENUES AND OTHER SOURCES
            General  Sales Tax  $         3,900, 000  $                 -    $                 -    $       1,700, 000  $                 -    $                 -    $                 -    $       5,600, 000
            Property Tax                  1,733, 356                     -                       -                       -                256, 878                     -                       -             1,990,235
            Charge for Services                     -             4,585,075                     -                       -                       -                       -                       -             4,585,075
            Hotel Tax                     -                       -                       -                853,642                     -                       -                       -                853,642
            Beverage Tax                    62,500                     -                       -                       -                       -                       -                       -                  62,500
            Franchise Fees                 983, 815                     -                       -                       -                       -                       -                       -                983,815
            Permits and Fees Other         263, 303                     -                    6,000                     -                       -                       -                       -                269,303
            Permits and Fees Building     4,357, 571                     -                       -                       -                       -                       -                       -             4,357,571
            Permits and Fees Utility                     -                274,441                     -                       -                       -                       -                       -                274,441
            Fines &  Forfeitures           715, 545                     -                       -                       -                       -                       -                       -                715,545
            Investment Earnings            178, 955   57,765   21,480    14,881                     -                  67,180                     -                340,261
            Contributions                   12,240                     -                       -                197,300                     -                       -                       -                209,540
            Misc Income                     39,785    23,460                     -                  69,587                     -                       -                       -                132,832
             Total Revenues              12,247, 070  4,940, 741  27,480  2,835, 410  256, 878  67,180            -                   20,374, 760
            Transfers In                    66,539                     -             1,476,065                     -             2,405,901  1,189,300                     -             5,137,805
            Other Sources                     -             2,600,000                     -                       -                       -             3,387,134                     -             5,987,134
             Total Other Sources           66,539  2,600, 000  1,476, 065       -                   2,405, 901  4,576, 434       -                   11,124, 939
            Academic Revenues                     -                       -                       -                       -                       -                       -             8,847,829  8,847,829
            Academic Others Sources                     -                       -                       -                       -                       -                       -                  76,000  76,000
             Total Academic -                 -                 -                 -                 -                 -                   8,923, 829  8,923, 829
            TOTAL REVENUES AND OTHER SOURCES  $     12,313, 609  $      7,540, 741  $      1,503, 545  $      2,835, 410  $      2,662, 779  $      4,643, 614  $      8,923, 829  $    40,423, 528

          EXPENDITURES  AND OTHER USES
            Payroll Salaries  $           3,994,572  $                 -    $                 -    $                 -    $                 -    $                 -    $                 -    $       3,994,572
            Payroll Transfer In        (  1,114,192)                      -                       -                       -                       -                       -                       -        (  1,114,192)
            Payroll Insurance              780,269                       -                       -                       -                       -                       -                       -              780,269
            Payroll Taxes TWC/ WC           43,482                       -                       -                       -                       -                       -                       -                43,482
            Payroll SS/ Medicare           305,506                       -                       -                       -                       -                       -                       -              305,506
            Payroll Retirement             486,093                       -                       -                       -                       -                       -                       -              486,093
             Total Payroll &  Related     4,495, 731       -                 -                 -                 -                 -                 -                   4,495, 731
            Debt                           351,680  2,015,626                       -                       -           2,689,990                       -                       -           5,057,296
            Economic Development                       -                       -                       -              336,940                       -                       -                       -              336,940
            Payroll Transfer Out                       -              559,024                       -              555,167                       -                       -                       -           1,114,192
            Rent &  Utilities              760,911  177,544                       -                80,614                       -                       -                       -           1,019,069
            Repair &  Maintenance          220,224  163,065                       -                       -                       -                       -                       -              383,289
            Services                      2,252,408  3,321,194                       -              329,516  3,610                       -                       -           5,906,728
            Supplies                       247,298    7,040                       -                11,762                       -                       -                       -              266,100
            Travel &  Training             209,064    7,920                       -                  5,919                       -                       -                       -              222,903
             Total Operations &  Maintenance  4,041, 584  6,251, 414       -                   1,319, 918  2,693, 600       -                 -                   14,306, 516
             TOTAL OPERATING EXPENDITURES  8,537, 315  6,251, 414       -                   1,319, 918  2,693, 600       -                 -                   18,802, 247
            Capital Project Funds                       -                       -                       -                       -                       -           4,676,681                       -           4,676,681
            Capital Outlay                  35,710   31,055                       -                       -                       -                       -                       -                66,765
            Maintenance &  Replacement                       -                       -           1,079,475                       -                       -                       -                       -           1,079,475
             Total Capital                 35,710    31,055  1,079, 475       -                 -                   4,676, 681       -                   5,822, 921
            Transfers Out                 3,491,966  81,539                       -           1,564,300                       -                       -                       -           5,137,805
             Total Other Uses             3,491, 966  81,539            -                   1,564, 300       -                 -                 -                   5,137, 805
            Academic Expenditures                       -                       -                       -                       -                       -                       -           8,710,132  8,710,132
            Academic Others Uses                       -                       -                       -                       -                       -                       -                76,000  76,000
             Total Academic -                 -                 -                 -                 -                 -                   8,786, 132  8,786, 132
             TOTAL NON- OPERATING EXPENDITURES  3,527, 676  112, 594  1,079, 475  1,564, 300       -                   4,676, 681  8,786, 132  19,746, 858
            TOTAL EXPENDITURES  AND OTHER USES  $     12,064, 992  $      6,364, 008  $      1,079, 475  $      2,884, 218  $      2,693, 600  $      4,676, 681  $      8,786, 132  $    38,549, 106
            Excess Revenus over ( under)  Expenditures  248,618  1,176, 733  424,070            (  48,808)           (  30,821)           (  33,067)             137,697  1,874, 422
            PY Beginning Fund Balance    10,242, 277  886, 329  1,053,144  1,301, 443  11,961  14,283, 223  939,271  939, 271
            PY Revenues/ Transfers ( estimated)           9,304,946  4,934, 415  901,480  2,793, 335  2,709,153  908, 570  8,562,645  8,562, 645
            PY Expenses/ Transfers ( estimated)      (  10,330, 613)       (  5,420, 005)          (  383,625)       ( 2,919, 470)       ( 2,690,293)       ( 7,989, 238)       ( 8,540,072)       ( 8,540, 072)
            BEGINNING FUND BALANCE        9,216, 613  400, 739  1,570, 999  1,175, 308  30,821  7,202, 555  961, 844  20,558, 876
            ENDING FUND BALANCE  $        9,465, 231  $         205, 060  $      1,995, 069  $      1,126, 499  $                 -    $       7,169, 488  $      1,099, 541  $    22,433, 298
                                                             73
   82   83   84   85   86   87   88   89   90   91   92