Page 86 - Ord 866 Adopting a revised Fiscal Year 17-18 and new proposed Fiscal Year 18-19 budget
P. 86

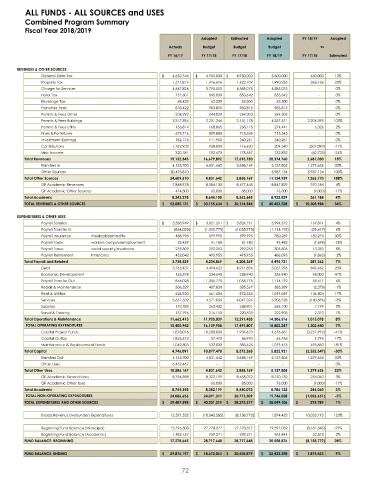
ALL FUNDS -  ALL SOURCES and USES
         Combined Program Summary
         Fiscal Year 2018/ 2019
                                                                   Adopted   Estimated   Adopted     FY 18/ 19  Adopted
                                                         Actuals    Budget    Budget      Budget           vs
                                                         FY 16/ 17  FY 17/ 18  FY 17/ 18  FY 18/ 19  FY 17/ 18  Estimated

       REVENUES &  OTHER SOURCES
               General Sales Tax                          4,650,744$           4,950,000$           4,950,000$           5,600,000  650,000  13%
               Property Tax                               1,577,814  1,476,616  1,622,109  1,990,235    368,126  23%
               Charge for Services                        4,647,826  3,795,515  4,585,075  4,585,075           -                         0%
               Hotel Tax                                   751,601    845,000   853,642     853,642              -                         0%
               Beverage Tax                                 68,432     62,500    62,500     62,500                -                         0%
               Franchise Fees                              818,422    983,815   983,815     983,815              -                         0%
               Permits &  Fees Other                       204,292    244,020   269,303     269,303              -                         0%
               Permits &  Fees Buildings                  3,317,394  2,201,246  2,151,178  4,357,571   2,206,393  103%
               Permits &  Fees Utility                     136,814    168,865   268,115     274,441      6,326  2%
               Fines &  Forfeitures                        673,716    809,880   715,545     715,545              -                         0%
               Investment Earnings                         182,174    111,965   340,261     340,261              -                         0%
               Contributions                              1,782,932   928,000   716,630     209,540              (  507,090)              -71%
               Misc Income                                 320,181    102,470   175,557     132,832              (  42,725)                -24%
         Total Revenues                                  19,132,343  16,679,892  17,693,730  20,374,760  2,681,030  15%
               Transfers In                               4,133,700  4,831,642  3,858,169  5,137,805   1,279,636  33%
               Other Sources                             20,475,810         -                      -                        5,987,134  5,987,134  100%
         Total Other Sources                             24,609,510  4,831,642  3,858,169  11,124,939  7,266,770  188%
               GF Academic Revenues                       7,868,978  8,584,100  8,477,645  8,847,829    370,184  4%
                                                                                                                11%
               GF Academic Other Sources                   474,300     60,000    85,000     76,000                (  9,000)                  -
         Total Academic                                   8,343,278  8,644,100  8,562,645  8,923,829    361,184  4%
         TOTAL REVENUES &  OTHER SOURCES                 52,085,131$         30,155,634$        30,114,544$         40,423,528$         10,308,984$         34%
       EXPENDITURES &  OTHER USES
               Payroll Salaries                           3,388,949$           3,821,261$           3,824,761$           3,994,572  169,811  4%
               Payroll Transfer In (                       864,028)             ( 1,055,775)          ( 1,055,775)          (  1,114,192)          (  58,417)                6%
               Payroll Insurance  medical/ dental/ life    488,798    599,995   599,995     780,269     180,274  30%
               Payroll Taxes   workers comp/ unemployment   33,459     51,180    51,180     43,482                (  7,698)                  -
                                                                                                                15%
               Payroll Taxes   social security/ medicare   239,309    292,253   292,253     305,506     13,253  5%
                                                                                                                2%
               Payroll Retirement  tmrs/ icma              452,042    495,955   495,955     486,093              (  9,862)                  -
         Total Payroll and Related                        3,738,529  4,204,869  4,208,369  4,495,731    287,362  7%
               Debt                                       3,763,437  4,494,622  4,211,834  5,057,296    845,462  20%
               Economic Development                        163,578    234,640   238,940     336,940     98,000  41%
               Payroll Transfer Out                        864,028   1,055,775  1,055,775  1,114,192    58,417  6%
               Repair &  Maintenance                       306,329    407,830   385,567     383,289              (  2,278)                  -
                                                                                                                1%
               Rent & Utilities                            624,930    661,604   872,565    1,019,069    146,504  17%
               Services                                   5,631,532  4,571,056  6,047,324  5,906,728           (  140,596)              -2%
               Supplies                                    170,783    263,402   258,901     266,100      7,199  3%
               Travel &  Training                          137,796    216,110   220,533     222,903      2,370  1%
         Total Operations & Maintenance                  11,662,413  11,905,039  13,291,438  14,306,516  1,015,078  8%
         TOTAL OPERATING EXPENDITURES                    15,400,942  16,109,908  17,499,807  18,802,247  1,302,440  7%
               Capital Project Funds                      1,878,076  10,288,000  7,934,673  4,676,681           (  3,257,992)           -41%
               Capital Outlay                             1,825,512    57,470    56,970     66,765       9,795  17%
               Maintenance &  Replacement Funds           1,042,503   532,000   383,625    1,079,475    695,850  181%
         Total Capital                                    4,746,091  10,877,470  8,375,268  5,822,921           (  2,552,347)           -30%
               Transfers Out                              4,133,700  4,831,642  3,858,169  5,137,805   1,279,636  33%
               Other Uses                                 6,452,467           -                      -                      -                      -                         0%
         Total Other Uses                                10,586,167  4,831,642  3,858,169  5,137,805   1,279,636  33%
               GF Academic Expenditures                   8,754,398  8,322,199  8,455,072  8,710,132    255,060  3%
                                                                                                                11%
               GF Academic Other Uses -                                60,000    85,000     76,000                (  9,000)                  -
         Total Academic                                   8,754,398  8,382,199  8,540,072  8,786,132    246,060  3%
         TOTAL NON-OPERATING EXPENDITURES                24,086,656  24,091,311  20,773,509  19,746,858         (  1,026,651)           -5%
         TOTAL EXPENDITURES AND OTHER SOURCES            39,487,598$         40,201,219$        38,273,317$         38,549,106$         275,789$             1%
               Excess Revenus over(under) Expenditures   12,597,532         (  10,045,585)        (  8,158,772)            1,874,422  10,033,195  123%

               Beginning Fund Balance (Municipal)        15,796,508  27,778,377  27,778,377  19,597,032         (  8,181,345)           -29%
               Beginning Fund Balance (Academic)          1,482,157   939,271   939,271     961,844     22,573  2%
         FUND BALANCE,  BEGINNING                        17,278,665  28,717,648  28,717,648  20,558,876         (  8,158,772)           28%
         FUND BALANCE,  ENDING                           29,876,197$         18,672,063$        20,558,879$         22,433,298$         1,874,423$          9%

                                                             72
   81   82   83   84   85   86   87   88   89   90   91