
Page 196 - Ord 866 Adopting a revised Fiscal Year 17-18 and new proposed Fiscal Year 18-19 budget
P. 196
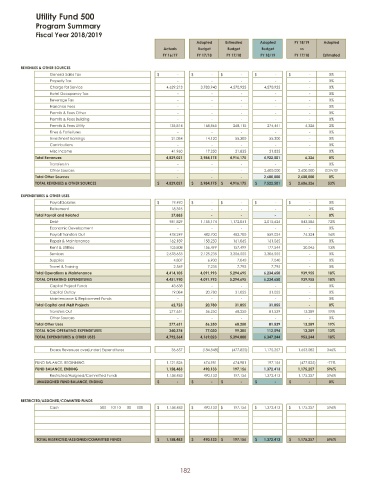
Utility Fund 500
             Program Summary
             Fiscal Year 2018/2019
                                                                  Adopted  Estimated   Adopted    FY 18/ 19  Adopted
                                                       Actuals    Budget    Budget     Budget       vs
                                                       FY 16/ 17  FY 17/ 18  FY 17/ 18  FY 18/ 19  FY 17/ 18  Estimated

        REVENUES &  OTHER SOURCES
                 General Sales Tax -$                   -$                   -$                   -$                   -$                     0%
                 Property Tax -                     -                     -                     -                     -                       0%
                 Charge for Service                     4,629,213  3,783,940  4,570,925  4,570,925          -                       0%
                 Hotel Occupancy Tax -                     -                     -                     -                     -                       0%
                 Beverage Tax -                     -                     -                     -                     -                       0%
                 Franchise Fees -                     -                     -                     -                     -                       0%
                 Permits &  Fees Other -                     -                     -                     -                     -                       0%
                 Permits &  Fees Building -                     -                     -                     -                     -                       0%
                 Permits &  Fees Utility                 136,814    168,865   268,115    274,441      6,326   2%
                 Fines &  Forfeitures -                     -                     -                     -                     -                       0%
                 Investment Earnings                      21,034     14,120    55,300     55,300               -                       0%
                 Contributions -                     -                     -                     -                     -                       0%
                 Misc Income                              41,960     17,250    21,835     21,835               -                       0%
             Total Revenues                             4,829,021  3,984,175  4,916,175  4,922,501    6,326   0%
                 Transfers In -                     -                     -                     -                     -                       0%
                 Other Sources -                     -                     -                       2,600,000  2,600,000          # DIV/ 0!
             Total Other Sources -                    -                    -                      2,600,000  2,600,000  0%
             TOTAL REVENUES &  OTHER SOURCES            4,829,021$          3,984,175$         4,916,175$          7,522,501$          2,606,326$          53%
        EXPENDITURES &  OTHER USES
                 Payroll Salaries                         19,490$             -$                   -$                   -$                   -$                     0%
                 Retirement                               18,395               -                     -                     -                     -                       0%
             Total Payroll and Related                    37,885               -                    -                    -                    -                      0%
                 Debt                                    981,829   1,155,174  1,172,041  2,015,626   843,585  72%
                 Economic Development -                     -                     -                     -                     -                       0%
                 Payroll Transfers Out                   478,249    482,700   482,700    559,024     76,324  16%
                 Repair &  Maintenance                   162,189    158,250   161,065    161,065             -                       0%
                 Rent & Utilities                        105,808    156,499   157,499    177,544     20,045  13%
                 Services                               2,678,655  2,125,235  3,306,555  3,306,555          -                       0%
                 Supplies                                 4,807       6,900    7,040       7,040                 -                       0%
                 Travel &  Training                       2,569       7,235    7,795       7,795                 -                       0%
             Total Operations & Maintenance             4,414,105  4,091,993  5,294,695  6,234,650  939,955  18%
             TOTAL OPERATING EXPENDITURES               4,451,990  4,091,993  5,294,695  6,234,650  939,955  18%
                 Capital Project Funds                    43,638               -                     -                     -                     -                       0%
                 Capital Outlay                           19,084     20,780    31,055     31,055               -                       0%
                 Maintenance &  Replacment Funds -                     -                     -                     -                     -                       0%
             Total Capital and M&R Projects               62,723     20,780    31,055     31,055               -                      0%
                 Transfers Out                           277,651     56,250    68,250     81,539     13,289  19%
                 Other Sources -                     -                     -                     -                     -                       0%
             Total Other Uses                            277,651     56,250    68,250     81,539     13,289  19%
             TOTAL NON- OPERATING EXPENDITURES           340,374     77,030    99,305    112,594     13,289  13%
             TOTAL EXPENDITURES &  OTHER USES           4,792,364  4,169,023  5,394,000  6,347,244  953,244  18%

                 Excess Revenues over(under) Expenditures  36,657               (  184,848)            ( 477,825)              1,175,257  1,653,082  346%
             FUND BALANCE,  BEGINNING                   1,121,826   674,981   674,981    197,156             (  477,825)            -71%
             FUND BALANCE,  ENDING                      1,158,483   490,133   197,156   1,372,413  1,175,257  596%
                 Restricted/ Assigned/ Committed Funds  1,158,483   490,133   197,156   1,372,413   1,175,257  596%
             UNASSIGNED FUND BALANCE,  ENDING -$                  -$                  -$                  -$                  -$                    0%


        RESTRICTED/ ASSIGNED/ COMMITED FUNDS
                 Cash             500  10110  00  000   1,158,483$          490,133$             197,156$             1,372,413$          1,175,257$         596%


             TOTAL RESTRICTED/ ASSIGNED/ COMMITTED FUNDS  1,158,483$          490,133$             197,156$             1,372,413$          1,175,257$         596%


                                                             182