
Page 192 - Ord 866 Adopting a revised Fiscal Year 17-18 and new proposed Fiscal Year 18-19 budget
P. 192
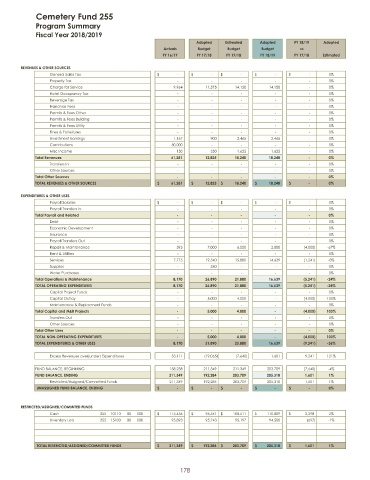
Cemetery Fund 255
Program Summary
Fiscal Year 2018/2019
Adopted Estimated Adopted FY 18/ 19 Adopted
Actuals Budget Budget Budget vs
FY 16/ 17 FY 17/ 18 FY 17/ 18 FY 18/ 19 FY 17/ 18 Estimated
REVENUES & OTHER SOURCES
General Sales Tax -$ -$ -$ -$ -$ 0%
Property Tax - - - - - 0%
Charge for Service 9,964 11,575 14,150 14,150 - 0%
Hotel Occupancy Tax - - - - - 0%
Beverage Tax - - - - - 0%
Franchise Fees - - - - - 0%
Permits & Fees Other - - - - - 0%
Permits & Fees Building - - - - - 0%
Permits & Fees Utility - - - - - 0%
Fines & Forfeitures - - - - - 0%
Investment Earnings 1,167 900 2,465 2,465 - 0%
Contributions 50,000 - - - - 0%
Misc Income 150 350 1,625 1,625 - 0%
Total Revenues 61,281 12,825 18,240 18,240 - 0%
Transfers In - - - - - 0%
Other Sources - - - - - 0%
Total Other Sources - - - - - 0%
TOTAL REVENUES & OTHER SOURCES 61,281$ 12,825$ 18,240$ 18,240$ -$ 0%
EXPENDITURES & OTHER USES
Payroll Salaries -$ -$ -$ -$ -$ 0%
Payroll Transfers In - - - - - 0%
Total Payroll and Related - - - - - 0%
Debt - - - - - 0%
Economic Development - - - - - 0%
Insurance - - - - - 0%
Payroll Transfers Out - - - - - 0%
Repair & Maintenance 395 7,000 6,000 2,000 ( 4,000) -67%
Rent & Utilities - - - - - 0%
Services 7,775 19,540 15,880 14,639 ( 1,241) -8%
Supplies - 350 - - - 0%
Water Purchases - - - - - 0%
Total Operations & Maintenance 8,170 26,890 21,880 16,639 ( 5,241) -24%
TOTAL OPERATING EXPENDITURES 8,170 26,890 21,880 16,639 ( 5,241) -24%
Capital Project Funds - - - - - 0%
Capital Outlay - 5,000 4,000 - ( 4,000) 100%
Maintenance & Replacment Funds - - - - - 0%
Total Capital and M&R Projects - 5,000 4,000 - ( 4,000) 100%
Transfers Out - - - - - 0%
Other Sources - - - - - 0%
Total Other Uses - - - - - 0%
TOTAL NON- OPERATING EXPENDITURES - 5,000 4,000 - ( 4,000) 100%
TOTAL EXPENDITURES & OTHER USES 8,170 31,890 25,880 16,639 ( 9,241) -36%
Excess Revenues over(under) Expenditures 53,111 ( 19,065) ( 7,640) 1,601 9,241 121%
FUND BALANCE, BEGINNING 158,238 211,349 211,349 203,709 ( 7,640) -4%
FUND BALANCE, ENDING 211,349 192,284 203,709 205,310 1,601 1%
Restricted/ Assigned/ Committed Funds 211,349 192,284 203,709 205,310 1,601 1%
UNASSIGNED FUND BALANCE, ENDING -$ -$ -$ -$ -$ 0%
RESTRICTED/ ASSIGNED/ COMMITED FUNDS
Cash 255 10110 00 000 115,456$ 96,541$ 108,511$ 110,809$ 2,298$ 2%
Inventory Lots 255 15100 00 000 95,893 95,743 95,197 94,500 ( 697) -1%
TOTAL RESTRICTED/ ASSIGNED/ COMMITTED FUNDS 211,349$ 192,284$ 203,709$ 205,310$ 1,601$ 1%
178