Page 189 - Ord 866 Adopting a revised Fiscal Year 17-18 and new proposed Fiscal Year 18-19 budget
P. 189

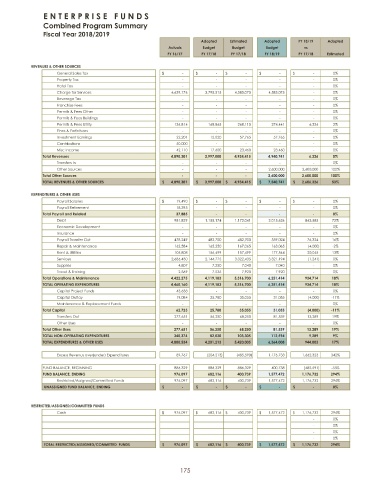
E N T E R P R I S E F U N D S
               Combined Program Summary
               Fiscal Year 2018/ 2019
                                                                   Adopted   Estimated  Adopted     FY 18/ 19  Adopted
                                                         Actuals    Budget    Budget     Budget      vs
                                                        FY 16/ 17   FY 17/ 18  FY 17/ 18  FY 18/ 19  FY 17/ 18  Estimated

           REVENUES &  OTHER SOURCES
                    General Sales Tax -$                   -$                   -$                   -$                   -$                     0%
                    Property Tax -                     -                     -                     -                     -                       0%
                    Hotel Tax -                     -                     -                     -                     -                       0%
                    Charge for Services                   4,639,176  3,795,515  4,585,075  4,585,075          -                       0%
                    Beverage Tax -                     -                     -                     -                     -                       0%
                    Franchise Fees -                     -                     -                     -                     -                       0%
                    Permits &  Fees Other -                     -                     -                     -                     -                       0%
                    Permits &  Fees Buildings -                     -                     -                     -                     -                       0%
                    Permits &  Fees Utility                136,814    168,865   268,115    274,441     6,326   2%
                    Fines &  Forfeitures -                     -                     -                     -                     -                       0%
                    Investment Earnings                    22,201     15,020    57,765     57,765               -                       0%
                    Contributions                          50,000               -                     -                     -                     -                       0%
                    Misc Income                            42,110     17,600    23,460     23,460               -                       0%
               Total Revenues                            4,890,301   3,997,000  4,934,415  4,940,741   6,326   0%
                    Transfers In -                     -                     -                     -                     -                       0%
                    Other Sources -                     -                     -                       2,600,000  2,600,000  100%
               Total Other Sources -                    -                    -                      2,600,000  2,600,000  100%
               TOTAL REVENUES &  OTHER SOURCES           4,890,301$          3,997,000$         4,934,415$          7,540,741$          2,606,326$          53%

           EXPENDITURES &  OTHER USES
                    Payroll Salaries                       19,490$             -$                   -$                   -$                   -$                     0%
                    Payroll Retirement                     18,395               -                     -                     -                     -                       0%
               Total Payroll and Related                   37,885               -                    -                    -                    -                      0%
                    Debt                                   981,829   1,155,174  1,172,041  2,015,626  843,585  72%
                    Economic Development -                     -                     -                     -                     -                       0%
                    Insurance -                     -                     -                     -                     -                       0%
                    Payroll Transfer Out                   478,249    482,700   482,700    559,024     76,324  16%
                    Repair & Maintenance                   162,584    165,250   167,065    163,065             (  4,000)                -2%
                    Rent & Utilities                       105,808    156,499   157,499    177,544     20,045  13%
                    Services                              2,686,430  2,144,775  3,322,435  3,321,194          (  1,241)                0%
                    Supplies                                4,807      7,250     7,040      7,040                 -                       0%
                    Travel &  Training                      2,569      7,535     7,920      7,920                 -                       0%
               Total Operations & Maintenance            4,422,275   4,119,183  5,316,700  6,251,414  934,714  18%
               TOTAL OPERATING EXPENDITURES              4,460,160   4,119,183  5,316,700  6,251,414  934,714  18%
              1     Capital Project Funds                  43,638               -                     -                     -                     -                       0%
              2     Capital Outlay                         19,084     25,780    35,055     31,055               (  4,000)                -11%
              3     Maintenance &  Replacement Funds -                     -                     -                     -                     -                       0%
               Total Capital                               62,723     25,780    35,055     31,055               (  4,000)               -11%
                    Transfers Out                          277,651    56,250    68,250     81,539      13,289  19%
                    Other Uses -                     -                     -                     -                     -                       0%
               Total Other Uses                            277,651    56,250    68,250     81,539     13,289   19%
               TOTAL NON- OPERATING EXPENDITURES           340,374    82,030   103,305     112,594     9,289   9%
               TOTAL EXPENDITURES &  OTHER USES          4,800,534   4,201,213  5,420,005  6,364,008  944,003  17%

                    Excess Revenus over(under) Expenditures  89,767               (  204,213)            ( 485,590)              1,176,733  1,662,323  342%

               FUND BALANCE, BEGINNING                     886,329    886,329   886,329    400,738             (  485,591)            -55%
               FUND BALANCE,  ENDING                       976,097    682,116  400,739    1,577,472  1,176,732  294%
                    Restricted/ Assigned/ Committed Funds  976,097    682,116   400,739   1,577,472  1,176,732  294%
               UNASSIGNED FUND BALANCE,  ENDING -$                  -$                  -$                  -$                  -$                    0%

           RESTRICTED/ ASSIGNED/ COMMITTED FUNDS
                    Cash                                   976,097$             682,116$            400,739$             1,577,472$          1,176,732$         294%
                                                                                                               0%
                                                                                                               0%
                                                                                                               0%
                                                                                                               0%
               TOTAL RESTRICTED/ ASSIGNED/ COMMITTED FUNDS  976,097$             682,116$            400,739$             1,577,472$          1,176,732$         294%


                                                             175
   184   185   186   187   188   189   190   191   192   193   194