
Page 248 - Saginaw FY19 Annual Budget
P. 248
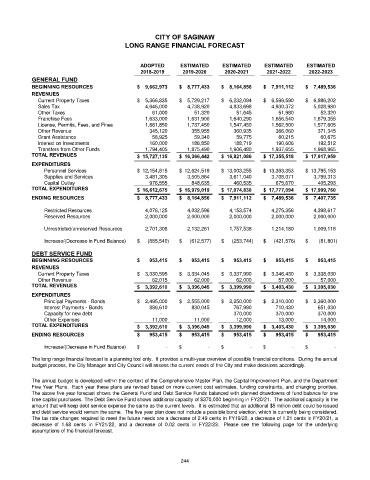
CITY OF SAGINAW
                                          LONG RANGE FINANCIAL FORECAST


                                               ADOPTED       ESTIMATED     ESTIMATED     ESTIMATED    ESTIMATED
                                                2018-2019    2019-2020     2020-2021     2021-2022     2022-2023
            GENERAL FUND
            BEGINNING RESOURCES               $     9,662,973  $     8,777,433  $     8,164,856  $     7,911,112  $     7,489,536
            REVENUES
              Current Property Taxes          $     5,366,835  $     5,729,217  $     6,232,094  $     6,599,590  $     6,986,202
              Sales Tax                              4,646,000         4,738,920         4,833,698         4,930,372         5,028,980
              Other Taxes                                 61,000              51,320              51,645              51,980              52,320
              Franchise Fees                         1,633,000         1,631,900         1,640,290         1,656,540         1,679,355
              License, Permits, Fees, and Fines         1,661,850         1,737,450         1,547,450         1,562,500         1,577,605
              Other Revenue                             345,120            355,955            360,935            366,060            371,345
              Grant Assistance                            58,925              59,340              59,775              60,215              60,675
              Interest on Investments                   160,000            186,850            188,719            190,606            192,512
              Transfers from Other Funds             1,794,405         1,875,490         1,906,480         1,937,655         1,968,965
            TOTAL REVENUES                    $   15,727,135  $   16,366,442  $   16,821,086  $   17,355,518  $   17,917,959
            EXPENDITURES
                Personnel Services            $   12,154,815  $   12,624,519  $   13,003,255  $   13,393,353  $   13,795,153
                Supplies and Services                3,481,305         3,505,864         3,611,040         3,708,071         3,799,313
                Capital Outlay                          976,555            848,635            460,535            675,670            405,293
            TOTAL EXPENDITURES                $   16,612,675  $   16,979,019  $   17,074,830  $   17,777,094  $   17,999,760
            ENDING RESOURCES                  $     8,777,433  $     8,164,856  $     7,911,112  $     7,489,536  $     7,407,735

                Restricted Resources                 4,076,125         4,032,596         4,153,574         4,275,356         4,398,617
                Reserved Resources                   2,000,000         2,000,000         2,000,000         2,000,000         2,000,000

                Unrestricted/unreserved Resources         2,701,308         2,132,261         1,757,538         1,214,180         1,009,118

                Increase/(Decrease in Fund Balance)  $       (885,540)  $       (612,577)  $       (253,744)  $       (421,576)  $         (81,801)

            DEBT SERVICE FUND
            BEGINNING RESOURCES               $        953,415  $        953,415  $        953,415  $        953,415  $        953,415
            REVENUES
              Current Property Taxes          $     3,330,595  $     3,334,045  $     3,337,990  $     3,346,430  $     3,338,030
              Other Revenue                               62,015                62,000              62,000              57,000              57,000
            TOTAL REVENUES                    $     3,392,610  $     3,396,045  $     3,399,990  $     3,403,430  $     3,395,030
            EXPENDITURES
                Principal Payments - Bonds    $     2,495,000  $     2,555,000  $     2,250,000  $     2,310,000  $     2,360,000
                Interest Payments - Bonds               886,610            830,045            767,990            710,430            651,030
                Capacity for new debt                          -                       -            370,000            370,000            370,000
                Other Expenses                            11,000              11,000              12,000              13,000              14,000
            TOTAL EXPENDITURES                $     3,392,610  $     3,396,045  $     3,399,990  $     3,403,430  $     3,395,030
            ENDING RESOURCES                  $        953,415  $        953,415  $        953,415  $        953,415  $        953,415

                Increase/(Decrease in Fund Balance)  $                      -  $                      -  $                      -  $                      -  $                      -

            The long range financial forecast is a planning tool only.  It provides a multi-year overview of possible financial conditions.  During the annual
            budget process, the City Manager and City Council will assess the current needs of the City and make decisions accordingly.

            The annual budget is developed within the context of the Comprehensive Master Plan, the Capital Improvement Plan, and the Department
            Five Year Plans. Each year these plans are revised based on more current cost estimates, funding constraints, and changing priorities.
            The above five year forecast shows the General Fund and Debt Service Funds balanced with planned drawdowns of fund balance for one
            time capital purchases. The Debt Service Fund shows additional capacity of $370,000 beginning in FY20/21. The additional capacity is the
            amount that will keep debt service expense the same as the current levels. It is estimated that an additional $5 million debt could be issued
            and debt service would remain the same. The five year plan does not include a possible bond election, which is currently being considered.
            The tax rate changes required to meet the future needs are a decrease of 2.49 cents in FY19/20, a decrease of 1.21 cents in FY20/21, a
            decrease of 1.68 cents in FY21/22, and a decrease of 0.02 cents in FY22/23. Please see the following page for the underlying
            assumptions of the financial forecast.


                                                             244