
Page 296 - Cover 3.psd
P. 296
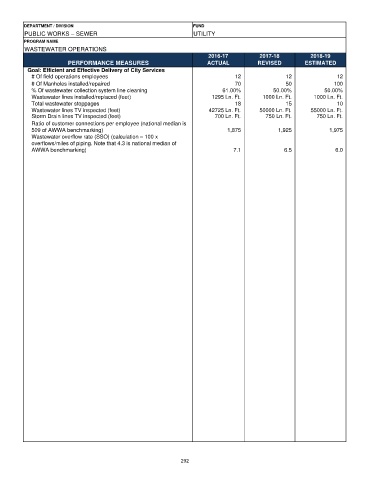
DEPARTMENT / DIVISION                                   FUND
         PUBLIC WORKS – SEWER                                    UTILITY
         PROGRAM NAME
         WASTEWATER OPERATIONS
                                                                      2016-17          2017-18          2018-19
                       PERFORMANCE MEASURES                           ACTUAL          REVISED         ESTIMATED
          Goal: Efficient and Effective Delivery of City Services
           # Of field operations employees                                     12               12              12
           # Of Manholes installed/repaired                                    70               50             100
           % Of wastewater collection system line cleaning                 61.00%          50.00%           50.00%
           Wastewater lines installed/replaced (feet)                  1295 Ln. Ft.     1000 Ln. Ft.     1000 Ln. Ft.
           Total wastewater stoppages                                          18               15              10
           Wastewater lines TV inspected (feet)                       42725 Ln. Ft.    50000 Ln. Ft.    55000 Ln. Ft.
           Storm Drain lines TV inspected (feet)                        700 Ln. Ft.      750 Ln. Ft.      750 Ln. Ft.
           Ratio of customer connections per employee (national median is
           509 of AWWA benchmarking)                                        1,875            1,925            1,975
           Wastewater overflow rate (SSO) (calculation – 100 x
           overflows/miles of piping. Note that 4.3 is national median of
           AWWA benchmarking)                                                 7.1              6.5              6.0


                                                             292