
Page 115 - Cover 3.psd
P. 115
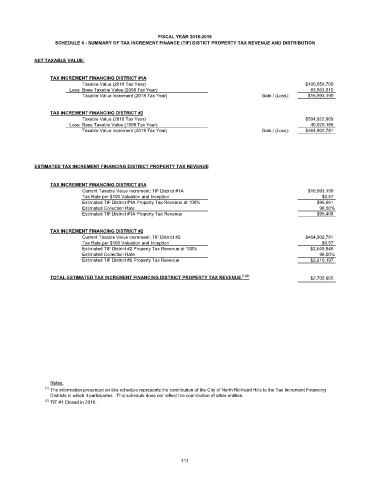
FISCAL YEAR 2018-2019
                   SCHEDULE 6 - SUMMARY OF TAX INCREMENT FINANCE (TIF) DISTICT PROPERTY TAX REVENUE AND DISTRIBUTION


            NET TAXABLE VALUE:


                  TAX INCREMENT FINANCING DISTRICT #1A
                            Taxable Value (2018 Tax Year)                                             $100,556,700
                        Less: Base Taxable Value (2008 Tax Year)                                        83,563,510
                            Taxable Value Increment (2018 Tax Year)                     Gain / (Loss):  $16,993,190


                  TAX INCREMENT FINANCING DISTRICT #2
                            Taxable Value (2018 Tax Year)                                             $504,922,969
                        Less: Base Taxable Value (1998 Tax Year)                                        40,020,188
                            Taxable Value Increment (2018 Tax Year)                     Gain / (Loss):  $464,902,781


            ESTIMATED TAX INCREMENT FINANCING DISTRICT PROPERTY TAX REVENUE


                  TAX INCREMENT FINANCING DISTRICT #1A
                            Current Taxable Value Increment: TIF District #1A                          $16,993,190
                            Tax Rate per $100 Valuation and Inception                                       $0.57
                            Estimated TIF District #1A Property Tax Revenue at 100%                       $96,861
                            Estimated Collection Rate                                                      98.50%
                            Estimated TIF District #1A Property Tax Revenue                               $95,408

                  TAX INCREMENT FINANCING DISTRICT #2
                            Current Taxable Value Increment: TIF District #2                          $464,902,781
                            Tax Rate per $100 Valuation and Inception                                       $0.57
                            Estimated TIF District #2 Property Tax Revenue at 100%                      $2,649,946
                            Estimated Collection Rate                                                      98.50%
                            Estimated TIF District #2 Property Tax Revenue                              $2,610,197


                  TOTAL ESTIMATED TAX INCREMENT FINANCING DISTRICT PROPERTY TAX REVENUE  (1)(2)         $2,705,605


                  Notes:
                (1)
                  The information presented on this schedule represents the contribution of the City of North Richland Hills to the Tax Increment Financing
                  Districts in which it participates.  This schedule does not reflect the contribution of other entities.
                (2)  TIF #1 Closed in 2018.


                                                             111