
Page 112 - Cover 3.psd
P. 112
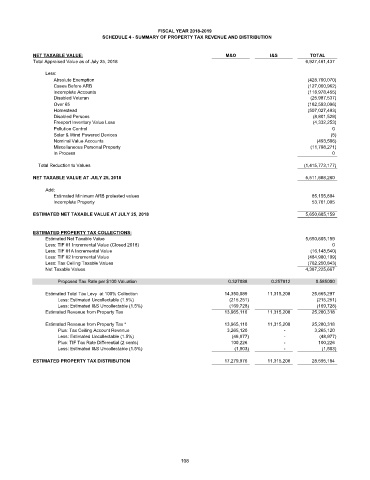
FISCAL YEAR 2018-2019
                                     SCHEDULE 4 - SUMMARY OF PROPERTY TAX REVENUE AND DISTRIBUTION


            NET TAXABLE VALUE:                                              M&O           I&S           TOTAL
            Total Appraised Value as of July 25, 2018                                                 6,927,461,437

                Less:
                   Absolute Exemption                                                                  (428,700,070)
                   Cases Before ARB                                                                    (127,060,962)
                   Incomplete Accounts                                                                 (118,978,455)
                   Disabled Veteran                                                                     (25,987,537)
                   Over 65                                                                             (182,593,096)
                   Homestead                                                                           (507,027,493)
                   Disabled Persons                                                                      (8,801,529)
                   Freeport Inventory Value Loss                                                         (4,332,253)
                   Pollution Control                                                                           0
                   Solar & Wind Powered Devices                                                               (5)
                   Nominal Value Accounts                                                                 (493,506)
                   Miscellaneous Personal Property                                                      (11,798,271)
                   In Process                                                                                  0

                Total Reduction to Values                                                             (1,415,773,177)
            NET TAXABLE VALUE AT JULY 25, 2018                                                        5,511,688,260

                Add:
                   Estimated Minimum ARB protested values                                               85,155,894
                   Incomplete Property                                                                  53,761,005

            ESTIMATED NET TAXABLE VALUE AT JULY 25, 2018                                              5,650,605,159


            ESTIMATED PROPERTY TAX COLLECTIONS:
                Estimated Net Taxable Value                                                           5,650,605,159
                Less: TIF #1 Incremental Value (Closed 2018)                                                   0
                Less: TIF #1A Incremental Value                                                         (16,148,540)
                Less: TIF #2 Incremental Value                                                         (484,980,109)
                Less: Tax Ceiling Taxable Values                                                       (762,250,843)
                Net Taxable Values                                                                    4,387,225,667

                    Proposed Tax Rate per $100 Valuation                     0.327088      0.257912      0.585000
                Estimated Total Tax Levy  at 100% Collection               14,350,089     11,315,208    25,665,297
                    Less: Estimated Uncollectable (1.5%)                     (215,251)                    (215,251)
                    Less: Estimated I&S Uncollectable (1.5%)                 (169,728)                    (169,728)
                Estimated Revenue from Property Tax                        13,965,110     11,315,208    25,280,318

                Estimated Revenue from Property Tax *                            13,965,110             11,315,208             25,280,318
                    Plus: Tax Ceiling Account Revenue                               3,265,120                          -               3,265,120
                    Less: Estimated Uncollectable (1.5%)                                (48,977)                          -                  (48,977)
                    Plus: TIF Tax Rate Differential (2 cents)                          100,226                          -                  100,226
                    Less: Estimated I&S Uncollectable (1.5%)                              (1,503)                          -                    (1,503)

            ESTIMATED PROPERTY TAX DISTRIBUTION                                    17,279,976             11,315,208             28,595,184


                                                             108