Page 94 - Mansfield 2019 Operating Budget
P. 94

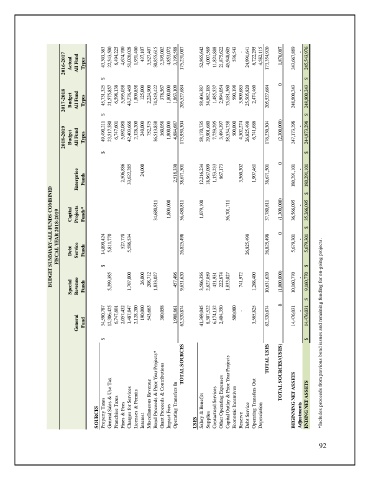
2016-2017  Actual  All Fund  Types  43,303,363  $           22,543,500               6,494,225                 4,674,700                 51,020,028               1,931,400                 437,107                    3,527,407                 30,855,615               2,395,002                 4,853,072                 3,195,588                 175,231,007  52,865,642               4,007,569                 11,824,888               21,875,622               45,948,6


                                                                                              0               -  $
                                                                               590,198
                                                       378,567
                                                 125,000
                      2017-2018  Budget  All Fund  Types  45,731,325  $         21,575,857             6,598,138               5,595,038               43,276,469             1,809,858                               2,224,900               74,549,422                             1,800,000               1,863,109               205,527,684           58,404,387             34,982,185             1,485,537               2,994,054               75,181,360                             3,909,68


                      2018-2019  Budget  All Fund  Types  49,490,211  $           23,517,580               6,747,601                 5,092,088                 42,403,666               2,128,200                 240,000                    752,375                    36,513,838               360,058                    1,800,000                 4,884,687                 173,930,304             58,170,735               29,901,680               7,759,295                 3,494,397


                           Enterprise  Funds  2,506,886               33,622,285             24,000                    2,518,330               38,671,501             12,216,234             18,967,099             1,153,233               867,173                  3,560,302               1,907,461               38,671,501             0  180,291,101           -                          -  180,291,101  $

                  BUDGET SUMMARY-ALL FUNDS COMBINED  FISCAL YEAR 2018-2019  Capital  Debt   Projects  Service  Funds*  Funds  14,899,424  $           5,811,770                 527,770                    5,586,534                 34,680,811            1,800,000              36,480,811            26,825,498               1,079,100              36,701,711            26,825,498               37,780,811            26,825,498               (1,300,000)            0  36,566,095            5,


                                                                    3,506,356
                                                              9,631,620
                                                     1,833,027
                                                            457,496
                                                                                          10,631,620
                                                                                 741,972
                                                                                      1,268,400
                                                                             1,833,027
                                                                      2,627,059
                                                                         431,931
                                                                           222,874
                                                 26,000
                                            1,707,000
                                      5,399,385
                                                   208,712
                           Revenue
                         Special
                             Funds


                                                                                              0  (1,000,000)            10,160,770           -                        -  9,160,770  $
                                                   543,663
                                                 190,000
                                                       360,058
                                                                               500,000
                                                                                 -
                           General  Fund  34,590,787  12,306,425  6,747,601  2,057,432  1,487,847  2,128,200  1,908,861  62,320,874  41,369,045  8,307,522  6,174,132  2,404,350                             3,565,825  62,320,874  14,476,031                             14,476,031
                                    $                                                                                                                                                                                           TOTAL SOURCES                                                                                                                       TOTAL USES  TOTAL SOURCES/(USES)                 $              *Includes proceeds from previous bond issues and remaining funding f
                                 SOURCES   Property Taxes  General Sales & Use Tax  Franchise Taxes  Fines & Fees  Charges for Services  Licenses & Permits  Interest  Miscellaneous Revenue Bond Proceeds & Prior Year Projects* Grant Proceeds & Contributions  Impact Fees  Operating Transfers In  USES  Salary & Benefits  Supplies  Contactural Services  Other Operating Expenses Capital Outlay & Prior Year Projects  Economic Incentives  Reserve  Debt Service  Operating Transfers Out  Depr
                                                                                                           92
   89   90   91   92   93   94   95   96   97   98   99