
Page 68 - Mansfield 2019 Operating Budget
P. 68
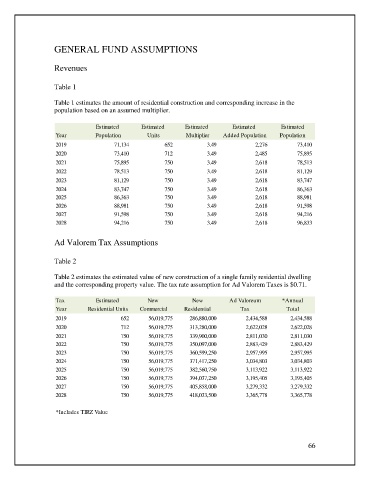
GENERAL FUND ASSUMPTIONS

                   Revenues

                   Table 1

                   Table 1 estimates the amount of residential construction and corresponding increase in the
                   population based on an assumed multiplier.

                                 Estimated      Estimated     Estimated       Estimated       Estimated
                   Year          Population       Units        Multiplier  Added Population   Population
                   2019                              71,134                         652                        3.49                           2,276                     73,410
                   2020                              73,410                         712                        3.49                           2,485                     75,895
                   2021                              75,895                         750                        3.49                           2,618                     78,513

                   2022                            78,513                         750                        3.49                           2,618                     81,129

                   2023                            81,129                         750                        3.49                           2,618                     83,747
                   2024                            83,747                         750                        3.49                           2,618                     86,363

                   2025                              86,363                         750                        3.49                           2,618                     88,981

                   2026                            88,981                         750                        3.49                           2,618                     91,598
                   2027                            91,598                         750                        3.49                           2,618                     94,216


                   2028                            94,216                         750                        3.49                           2,618                     96,833

                   Ad Valorem Tax Assumptions

                   Table 2

                   Table 2 estimates the estimated value of new construction of a single family residential dwelling
                   and the corresponding property value. The tax rate assumption for Ad Valorem Taxes is $0.71.

                   Tax           Estimated        New            New         Ad Valoreum      *Annual
                   Year       Residential Units  Commercial   Residential        Tax            Total
                   2019                                  652             56,019,775           286,880,000                    2,434,588                2,434,588
                   2020                                  712             56,019,775           313,280,000                    2,622,028                2,622,028
                   2021                                  750             56,019,775           339,900,000                    2,811,030                2,811,030
                   2022                                  750             56,019,775           350,097,000                    2,883,429                2,883,429
                   2023                                  750             56,019,775           360,599,250                    2,957,995                2,957,995
                   2024                                  750             56,019,775           371,417,250                    3,034,803                3,034,803
                   2025                                  750             56,019,775           382,560,750                    3,113,922                3,113,922
                   2026                                  750             56,019,775           394,037,250                    3,195,405                3,195,405
                   2027                                  750             56,019,775           405,858,000                    3,279,332                3,279,332
                   2028                                  750             56,019,775           418,033,500                    3,365,778                3,365,778

                   *Includes TIRZ Value


                                                                                                       66