
Page 66 - Mansfield 2019 Operating Budget
P. 66
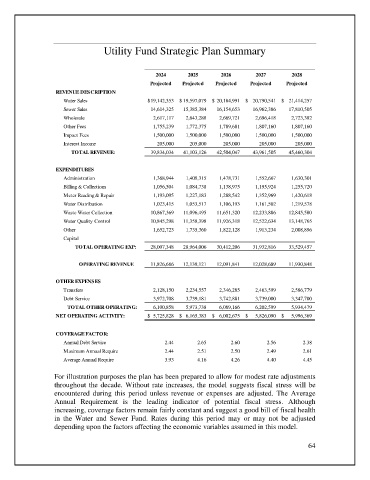
Utility Fund Strategic Plan Summary


                                                     2024      2025       2026        2027        2028
                                                   Projected  Projected  Projected  Projected   Projected
                   REVENUE DESCRIPTION
                      Water Sales                 $  19,142,353  $   19,597,079  $   20,184,991  $     20,790,541  $     21,414,257
                      Sewer Sales                     14,614,325       15,385,384       16,154,653         16,962,386         17,810,505
                      Wholesale                         2,617,117         2,643,288         2,669,721           2,696,418           2,723,382
                      Other Fees                        1,755,239         1,772,375         1,789,681           1,807,160           1,807,160
                      Impact Fees                       1,500,000         1,500,000         1,500,000           1,500,000           1,500,000
                      Interest Income                      205,000            205,000            205,000              205,000              205,000
                         TOTAL REVENUE:               39,834,034       41,103,126       42,504,047         43,961,505         45,460,304

                    EXPENDITURES
                      Administration                    1,368,944         1,408,315         1,478,731           1,552,667           1,630,301
                      Billing & Collections             1,056,504         1,084,738         1,138,975           1,195,924           1,255,720
                      Meter Reading & Repair            1,193,095         1,227,183         1,288,542           1,352,969           1,420,618
                      Water Distribution                1,023,415         1,053,517         1,106,193           1,161,502           1,219,578
                      Waste Water Collection          10,867,369       11,096,495       11,651,320         12,233,886         12,845,580
                      Water Quality Control           10,845,298       11,358,398       11,926,318         12,522,634         13,148,765
                      Other                             1,652,723         1,735,360         1,822,128           1,913,234           2,008,896
                      Capital
                          TOTAL OPERATING EXP:        28,007,348       28,964,006       30,412,206         31,932,816         33,529,457


                           OPERATING REVENUE          11,826,686       12,139,121       12,091,841         12,028,689         11,930,848

                   OTHER EXPENSES
                      Transfers                         2,128,150         2,234,557         2,346,285           2,463,599           2,586,779
                      Debt Service                      3,972,708         3,739,181         3,742,881           3,739,000           3,347,700
                       TOTAL OTHER OPERATING:           6,100,858         5,973,738         6,089,166           6,202,599           5,934,479
                   NET OPERATING ACTIVITY:        $    5,725,828  $     6,165,383  $     6,002,675  $       5,826,090  $       5,996,369


                   COVERAGE FACTOR:
                      Annual Debt Service                        2.44                  2.65                  2.60                    2.56                    2.38
                      Maximum Annual Require                     2.44                  2.51                  2.50                    2.49                    2.61
                      Average Annual Require                     3.93                  4.16                  4.26                    4.40                    4.45

                   For illustration purposes the plan has been prepared to allow for modest rate adjustments
                   throughout the decade. Without rate increases, the model suggests fiscal stress will be
                   encountered during this  period unless revenue or expenses are  adjusted. The Average
                   Annual Requirement is the leading indicator of potential fiscal stress. Although
                   increasing, coverage factors remain fairly constant and suggest a good bill of fiscal health
                   in  the Water  and Sewer Fund.  Rates during this period may  or may  not be adjusted
                   depending upon the factors affecting the economic variables assumed in this model.


                                                                                                       64