
Page 65 - Mansfield 2019 Operating Budget
P. 65
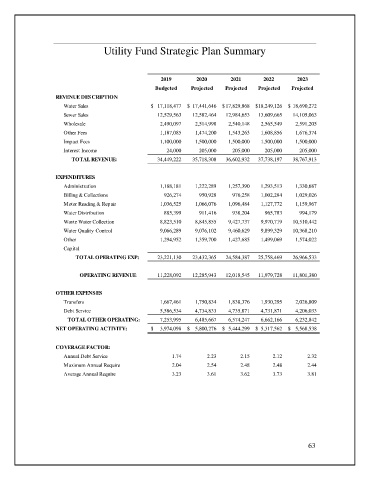
Utility Fund Strategic Plan Summary


                                                      2019        2020       2021       2022       2023
                                                    Budgeted    Projected   Projected  Projected  Projected
                   REVENUE DESCRIPTION
                      Water Sales                  $     17,118,477  $    17,441,646  $  17,829,868  $  18,249,126  $   18,690,272
                      Sewer Sales                         12,529,563        12,582,464      12,984,653      13,609,665       14,105,063
                      Wholesale                             2,490,097          2,514,998        2,540,148        2,565,549         2,591,205
                      Other Fees                            1,187,085          1,474,200        1,543,263        1,608,856         1,676,374
                      Impact Fees                           1,100,000          1,500,000        1,500,000        1,500,000         1,500,000
                      Interest Income                            24,000             205,000           205,000           205,000            205,000
                         TOTAL REVENUE:                   34,449,222        35,718,308      36,602,932      37,738,197       38,767,913


                   EXPENDITURES
                      Administration                        1,188,181          1,222,289        1,257,390        1,293,513         1,330,687
                      Billing & Collections                    926,274             950,928           976,258        1,002,284         1,029,026
                      Meter Reading & Repair                1,036,525          1,066,076        1,096,484        1,127,772         1,159,967
                      Water Distribution                       885,399             911,416           938,204           965,783            994,179
                      Waste Water Collection                8,823,510          8,845,855        9,427,737        9,970,719       10,510,442
                      Water Quality Control                 9,066,289          9,076,102        9,460,629        9,899,329       10,368,210
                      Other                                 1,294,952          1,359,700        1,427,685        1,499,069         1,574,022
                      Capital
                          TOTAL OPERATING EXP:            23,221,130        23,432,365      24,584,387      25,758,469       26,966,533


                           OPERATING REVENUE              11,228,092        12,285,943      12,018,545      11,979,728       11,801,380


                   OTHER EXPENSES
                      Transfers                             1,667,461          1,750,834        1,838,376        1,930,295         2,026,809
                      Debt Service                          5,586,534          4,734,833        4,735,871        4,731,871         4,206,033
                       TOTAL OTHER OPERATING:               7,253,995          6,485,667        6,574,247        6,662,166         6,232,842
                   NET OPERATING ACTIVITY:         $       3,974,098  $      5,800,276  $    5,444,299  $    5,317,562  $     5,568,538


                   COVERAGE FACTOR:
                      Annual Debt Service                            1.74                   2.23                 2.15                 2.12                  2.32
                      Maximum Annual Require                         2.04                   2.54                 2.48                 2.48                  2.44
                      Average Annual Require                         3.23                   3.61                 3.62                 3.73                  3.81


                                                                                                       63