
Page 213 - Mansfield 2019 Operating Budget
P. 213
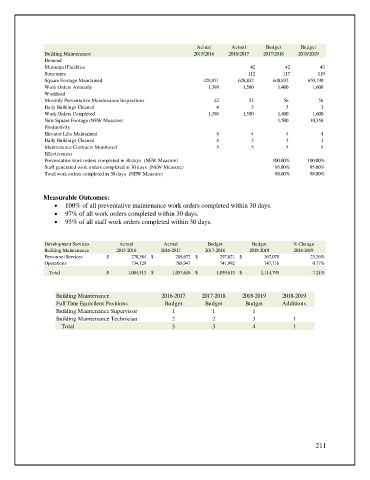
Actual      Actual     Budget      Budget
                Building Maintenance                             2015/2016   2016/2017  2017/2018   2018/2019
                Demand
                Municipal Facilities                                                42         42          43
                Structures                                                         112         117        119
                Square Footage Maintained                                     428,851               628,832               648,832               659,190
                Work Orders Annually                                              1,398                   1,560                   1,400                   1,600
                Workload
                Monthly Preventative Maintenance Inspections                           42                        52                        56                        56
                Daily Buildings Cleaned                                                  4                          3                          3                          3
                Work Orders Completed                                             1,398                   1,550                   1,400                   1,600
                New Square Footage (NEW Measure)                                                         1,500                 10,358
                Productivity
                Elevator Lifts Maintained                                               4                              4                          4                            4
                Daily Buildings Cleaned                                                   4                            3                            3                            3
                Maintenance Contracts Monitored                                           5                            5                            5                          5
                Effectiveness
                Preventative work orders completed in 30 days  (NEW Measure)               100.00%     100.00%
                Staff generated work orders completed in 30 days  (NEW Measure)             95.00%      95.00%
                Total work orders completed in 30 days  (NEW Measure)                       98.00%      98.00%


               Measurable Outcomes:
                   •  100% of all preventative maintenance work orders completed within 30 days.
                   •  97% of all work orders completed within 30 days.
                   •  95% of all staff work orders completed within 30 days.


                Development Services     Actual        Actual         Budget        Budget        % Change
                Building Maintenance    2015-2016     2016-2017      2017-2018      2018-2019     2018-2019
                Personnel Services  $                     270,384 $                     288,672 $                     297,821 $                     367,079  23.26%
                Operations                                 734,129                        768,947                        741,992                        747,716  0.77%
                 Total              $                  1,004,513 $                  1,057,618 $                  1,039,813 $                  1,114,795  7.21%


                    Building Maintenance              2016-2017     2017-2018    2018-2019    2018-2019
                    Full Time Equivilent Positions      Budget       Budget       Budget      Additions
                    Building Maintenance Supervisor       1            1             1
                    Building Maintenance Technician       2            2             3            1
                     Total                                3            3             4            1


                                                                                                         211