
Page 64 - FY 19 Budget Forecast 91218.xlsx
P. 64
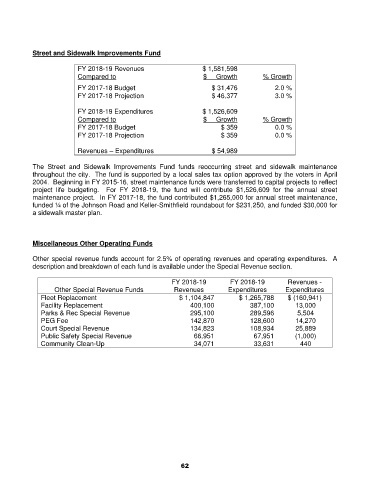
Street and Sidewalk Improvements Fund

                           FY 2018-19 Revenues                      $ 1,581,598
                           Compared to                              $     Growth        % Growth
                           FY 2017-18 Budget                           $ 31,476             2.0 %
                           FY 2017-18 Projection                       $ 46,377             3.0 %

                           FY 2018-19 Expenditures                  $ 1,526,609
                           Compared to                              $     Growth        % Growth
                           FY 2017-18 Budget                              $ 359             0.0 %
                           FY 2017-18 Projection                          $ 359             0.0 %

                           Revenues – Expenditures                     $ 54,989

            The Street  and Sidewalk Improvements Fund funds reoccurring street and sidewalk maintenance
            throughout the city.  The fund is supported by a local sales tax option approved by the voters in April
            2004.  Beginning in FY 2015-16, street maintenance funds were transferred to capital projects to reflect
            project life  budgeting.  For FY 2018-19, the fund will contribute $1,526,609 for the annual street
            maintenance project.  In FY 2017-18, the fund contributed $1,265,000 for annual street maintenance,
            funded ¼ of the Johnson Road and Keller-Smithfield roundabout for $231,250, and funded $30,000 for
            a sidewalk master plan.


            Miscellaneous Other Operating Funds

            Other special revenue funds account for 2.5% of operating revenues and operating expenditures.  A
            description and breakdown of each fund is available under the Special Revenue section.

                                                          FY 2018-19         FY 2018-19         Revenues -
                   Other Special Revenue Funds             Revenues         Expenditures       Expenditures
               Fleet Replacement                            $ 1,104,847         $ 1,265,788     $ (160,941)
               Facility Replacement                             400,100             387,100        13,000
               Parks & Rec Special Revenue                      295,100             289,596         5,504
               PEG Fee                                          142,870             128,600        14,270
               Court Special Revenue                            134,823             108,934        25,889
               Public Safety Special Revenue                      66,951             67,951        (1,000)
               Community Clean-Up                                 34,071             33,631          440


                                                             62