
Page 44 - FY 19 Budget Forecast 91218.xlsx
P. 44
FY 2018-19 STATISTICAL ANALYSIS
This statistical analysis summarizes the FY 2018-19 Adopted Budget by providing a summary of the
revenue and expenditures of the city’s various funds and provides a comparison to FY 2017-18 budget
and year-end projections.
GENERAL FUND
Revenue Assumptions:
General Fund Revenues
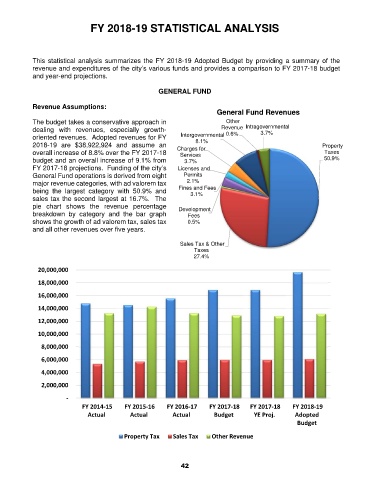
The budget takes a conservative approach in Other
dealing with revenues, especially growth- Revenue Intragovernmental
3.7%
oriented revenues. Adopted revenues for FY Intergovernmental 0.6%
8.1%
2018-19 are $38,922,924 and assume an Charges for Property
overall increase of 8.8% over the FY 2017-18 Services Taxes
budget and an overall increase of 9.1% from 3.7% 50.9%
FY 2017-18 projections. Funding of the city’s Licenses and
General Fund operations is derived from eight Permits
major revenue categories, with ad valorem tax 2.1%
being the largest category with 50.9% and Fines and Fees
3.1%
sales tax the second largest at 16.7%. The
pie chart shows the revenue percentage Development
breakdown by category and the bar graph Fees
shows the growth of ad valorem tax, sales tax 0.5%
and all other revenues over five years.
Sales Tax & Other
Taxes
27.4%
20,000,000
18,000,000
16,000,000
14,000,000
12,000,000
10,000,000
8,000,000
6,000,000
4,000,000
2,000,000
‐
FY 2014‐15 FY 2015‐16 FY 2016‐17 FY 2017‐18 FY 2017‐18 FY 2018‐19
Actual Actual Actual Budget YE Proj. Adopted
Budget
Property Tax Sales Tax Other Revenue
42