
Page 191 - Grapevine FY19 Operating Budget
P. 191
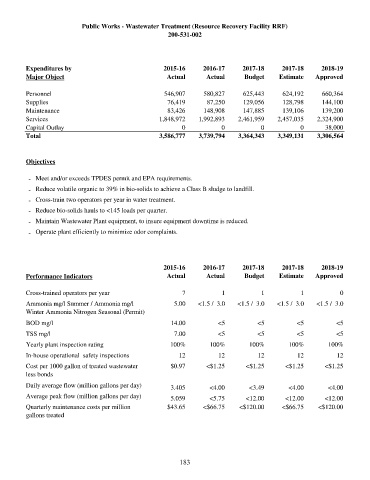
Public Works - Wastewater Treatment (Resource Recovery Facility RRF)
                                                      200-531-002


       Expenditures by                               2015-16      2016-17      2017-18      2017-18      2018-19
       Major Object                                   Actual       Actual      Budget      Estimate    Approved


       Personnel                                     546,907      580,827      625,443      624,192      660,364
       Supplies                                       76,419       87,250      129,056      128,798      144,100
       Maintenance                                    83,426      148,908      147,885      139,106      139,200
       Services                                    1,848,972    1,992,893    2,461,959    2,457,035     2,324,900
       Capital Outlay                                      0            0            0            0       38,000
       Total                                       3,586,777    3,739,794    3,364,343    3,349,131     3,306,564


       Objectives

        - Meet and/or exceeds TPDES permit and EPA requirements.
        - Reduce volatile organic to 39% in bio-solids to achieve a Class B sludge to landfill.

        - Cross-train two operators per year in water treatment.
        - Reduce bio-solids hauls to <145 loads per quarter.
        - Maintain Wastewater Plant equipment, to insure equipment downtime is reduced.
        - Operate plant efficiently to minimize odor complaints.


                                                     2015-16      2016-17      2017-18      2017-18      2018-19
       Performance Indicators                         Actual       Actual      Budget      Estimate    Approved


       Cross-trained operators per year                    7            1            1            1            0
       Ammonia mg/l Summer / Ammonia mg/l               5.00    <1.5 /  3.0  <1.5 /  3.0  <1.5 /  3.0  <1.5 /  3.0
       Winter Ammonia Nitrogen Seasonal (Permit)
       BOD mg/l                                        14.00           <5           <5           <5           <5
       TSS mg/l                                         7.00           <5           <5           <5           <5

       Yearly plant inspection rating                  100%         100%         100%         100%         100%
       In-house operational  safety inspections           12           12           12           12           12
       Cost per 1000 gallon of treated wastewater      $0.97       <$1.25       <$1.25       <$1.25       <$1.25
       less bonds
       Daily average flow (million gallons per day)    3.405        <4.00        <3.49        <4.00        <4.00
       Average peak flow (million gallons per day)     5.059        <5.75       <12.00       <12.00       <12.00

       Quarterly maintenance costs per million        $43.65      <$66.75     <$120.00      <$66.75     <$120.00
       gallons treated


                                                          183