
Page 163 - Fort Worth City Budget 2019
P. 163
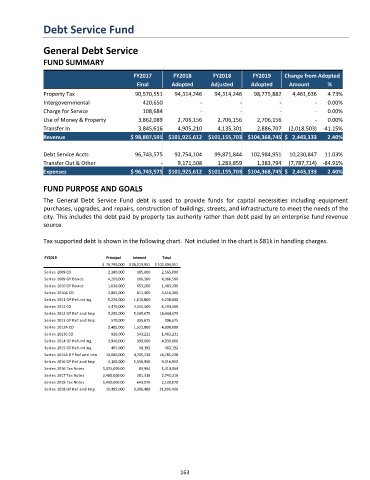
Debt Service Fund


               General Debt Service

               FUND SUMMARY

                                             FY2017       FY2018       FY2018        FY2019    Change from Adopted
                                              Final       Adopted      Adjusted     Adopted      Amount      %
               Property Tax                   90,570,551   94,314,246   94,314,246   98,775,882   4,461,636  4.73%
               Intergovernmental                420,650            -            -             -          -   0.00%
               Charge for Service               108,684            -            -             -          -   0.00%
               Use of Money & Property         3,862,089    2,706,156    2,706,156    2,706,156          -   0.00%
               Transfer In                     3,845,616    4,905,210    4,135,301    2,886,707  (2,018,503) -41.15%
               Revenue                      $ 98,807,591 $101,925,612  $101,155,703 $104,368,745 $   2,443,133  2.40%

               Debt Service Accts             96,743,575   92,754,104   99,871,844  102,984,951  10,230,847  11.03%
               Transfer Out & Other                   -     9,171,508    1,283,859    1,383,794  (7,787,714) -84.91%
               Expenses                     $ 96,743,575 $101,925,612  $101,155,703 $104,368,745 $   2,443,133  2.40%

               FUND PURPOSE AND GOALS
               The  General  Debt  Service  Fund  debt  is  used  to  provide  funds  for  capital  necessities  including  equipment
               purchases, upgrades, and repairs, construction of buildings, streets, and infrastructure to meet the needs of the
               city. This includes the debt paid by property tax authority rather than debt paid by an enterprise fund revenue
               source.

               Tax supported debt is shown in the following chart.  Not included in the chart is $81k in handling charges.


                FY2019              Principal  Interest  Total
                                   $  76,790,000  $ 26,113,951  $ 102,903,951
                Series 2009 CO       2,380,000  185,000  2,565,000
                Series 2009 GP Bonds  4,260,000  106,500  4,366,500
                Series 2010 GP Bonds  1,030,000  453,200  1,483,200
                Series 2010A CO      2,805,000  811,300  3,616,300
                Series 2011 GP Refunding  5,220,000  1,018,800  6,238,800
                Series 2012 CO       4,470,000  2,264,500  6,734,500
                Series 2012 GP Ref and Imp  9,295,000  5,149,675  14,444,675
                Series 2013 GP Ref and Imp  570,000  336,675  906,675
                Series 2013A CO      2,485,000  1,523,800  4,008,800
                Series 2013C CO       920,000  543,231  1,463,231
                Series 2014 GP Refunding  3,940,000  390,060  4,330,060
                Series 2015 GP Refunding  405,000  58,192  463,192
                Series 2015A GP Ref and Imp  10,080,000  4,705,238  14,785,238
                Series 2016 GP Ref and Imp  4,160,000  5,156,950  9,316,950
                Series 2016 Tax Notes  1,325,000.00  89,964  1,414,964
                Series 2017 Tax Notes  2,460,000.00  281,316  2,741,316
                Series 2018 Tax Notes  1,490,000.00  643,070  2,133,070
                Series 2018 GP Ref and Imp  19,495,000  2,396,480  21,891,480


                                                             163