
Page 438 - City of Arlington FY19 Adopted Operating Budget
P. 438
0% 9.9% 99% 19% 20,989 94% 20% 0 25% 49% 64% 89% 88% 65% 93% 82% 78% 8,199 2.4% 2,137 3,061 2% 100% 89.95%
Sept. 5,686 36
7.7% 99% 23% 24,126 0% 0 0 3% 100% 0%
Aug.
6.1% 98% 15% 22,970 0% 0 0 7% 100% 0%
July
100% 93% 77% 7.8% 98% 13% 22,544 25% 99% 21% 32% 0 24% 87% 92% 81% 4% 779 0 12% 100% 87%
June 6,072 48 12,586
10.8% 98% 15% 23,271 25% 0% 825 29,492 14% 100% 0%
May
10.5% 98% 11% 22,354 25% 0% 953 0 11% 100% 0%
April
83% 83% 100% 84% 79% 5.3% 99% 20% 21,493 64% 25% 91% 22% 75% 18% 83% 91% 42% 6,562 5% 613 12,604 14% 100% 89%
Mar. 5,683 44 200
5.0% 98% 17% 19,061 25% 93% 81% 67% 3,093 537 8,419 8% 100%
Feb.
5.9% 98% 15% 21,825 25% 95% 90% 80% 5,239 705 17,726 9% 100%
Jan.
100% 95% 85% 8.6% 98% 10% 17,948 25% 97% 20% 80% 56% 91% 94% 60% 5,084 1% 554 9,724 7% 100% 89%
Dec.
11.1% 98% 19% 17,924 25% 96% 20% 0 56 138 93% 88% 92% 3,744 2% 563 183 6% 100% 91%
Nov.
5.4% 99% 15% 20,052 25% 97% 20% 49% 64% 89% 88% 65% 86% 94% 76% 2,042 2% 797 0 7% 100% 90%
Oct.
83% 83% 75% 91% 80% 7.8% 98% 16% 254,557 64% 25% 95% 21% 62% 121% 49% 64% 89% 88% 65% 90% 64% 75% 46,549 16.4% 8,463 81,209 100% 100% 88.94%
FY 2018 Actual 5,683 6,072 5,686 23,242 1,907 2,022 1,872 44 48 36 180 17 18 17 394
0% 7.9% 98% 19% 68,085 94% 20% 0 25% 49% 64% 89% 88% 65% 93% 82% 78% 8,199 2.4% 2,137 3,061 12% 100% 89.95%
FY 2018 4th Qtr. Actual
100% 93% 77% 9.7% 98% 13% 68,169 25% 99% 21% 32% 0 24% 87% 92% 81% 12,586 4% 2,557 29,492 37% 100% 87%
FY 2018 3rd Qtr. Actual
83% 83% 100% 84% 79% 5.45% 98% 18% 62,379 64% 25% 91% 22% 75% 18% 89% 87% 64% 14,894 5% 1,855 38,749 31% 100% 89%
FY 2018 2nd Qtr. Actual 200
100% 95% 85% 8.9% 98% 15% 55,924 25% 97% 20% 80% 5,801 52 194 56% 49% 64% 89% 88% 65% 90% 92% 76% 10,870 5% 1,914 9,907 19% 100% 89%
FY 2018 1st Qtr. Actual
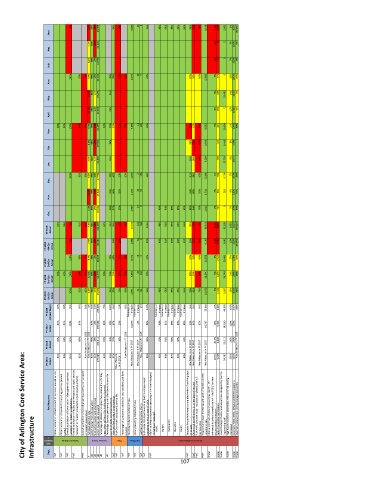
FY 2018 Annual Target 90% 90% 90% 90% 90% 5% 97% 10% 230,000 70% 100% 95% 15% 90% Maintain or Increase Maintain or Increase 275 100% Maintain or Increase Maintain or Increase Maintain or Increase Maintain or Increase Maintain or Increase 95% 95% 95% 35,000 20% 9,000 40,000 100% 100% >88%
84% 84% 100% 87% 97% 16% 239,588 63% 25% 97% 20% 23,879 155 88% 49% 64% 89% 88% 65% 93% 94% 82% 34,787 28% 9,194 68,099 100% 100%
FY 2017 Actual
85% 84% 100% 88% 96% 13% 264,311 62% 10% 97% 18% 96% 52% 64% 89% 88% 63% 20.2% 9,845 56,111 100% 100%
FY 2016 FY 2015 Actual Actual 86% 84% 100% 92% New Measure in FY 2018 New Measure in FY 2018 97% 11% 276,986 64% 25% 97% New Measure in FY 2016 New Measure in FY 2018 New Measure in FY 2017 New Measure in FY 2017 New Measure in FY 2018 89% 46% 64% 87% 69% 69% New Measure in FY 2017 New Measure in FY 2017 New Measure in FY 2017 New Measure in FY 2017 20.9% 9,825 34,767 100% 100% New Measure in FY 2018
City of Arlington Core Service Area: Key Measures Citizen perception of trash collection services [annual survey] Citizen perception of residential recycling services [annual survey] Overall satisfaction of Construction Management’s services “exceeds” or “meets” expectations Overall satisfaction of facility maintenance and repair services “exceeds” or “meets” expectations [surveyed quarterly] Overall satisfaction of custodial services contractor “exceeds” or “meets” e
Infrastructure
s
Customer Service
Categorie
Satisfaction Ratings
Solid Waste
Fleet
Goal
Dept.
PWT
PWT
PWT
PWT
PWT
PWT
PWT
PWT
PWT
PWT
PWT
PWT
PWT
MR
MR
MR
MR
MR
IT
107 PWT PWT PWT Infrastructure Maintenance PWT Water Water Water Water Water Water