


Page 122 - CityofSouthlakeFY27Budget
P. 122
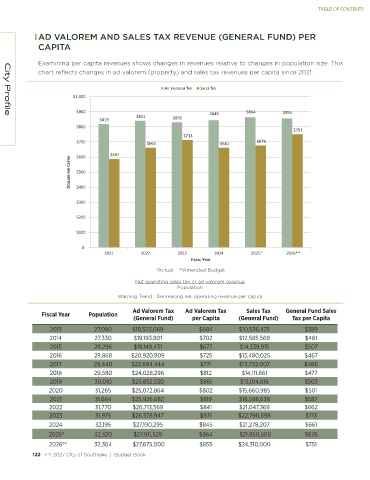
TABLE OF CONTENTS


              AD VALOREM AND SALES TAX REVENUE (GENERAL FUND) PER
              CAPITA

              Examining per capita revenues shows changes in revenues relative to changes in population size. This
              chart reflects changes in ad valorem (property) and sales tax revenues per capita since 2021.


                                                          s >KZ D d y  ^ > ^ d y
                         Ψϭ͕ϬϬϬ

                          ΨϵϬϬ                                        Ψϴϰϱ         Ψϴϲϰ        Ψϴϱϱ
                                              Ψϴϰϭ        Ψϴϯϭ
   City Profile
                                  Ψϴϭϵ
                          ΨϴϬϬ
                                                                                                  Ψϳϱϭ
                                                              Ψϳϭϯ
                          ΨϳϬϬ                    ΨϲϲϮ                    Ψϲϲϭ        Ψϲϳϲ
                                     Ψϱϴϳ
                          ΨϲϬϬ
                         K>> Z^ W Z   W/d   ΨϱϬϬ


                          ΨϰϬϬ

                          ΨϯϬϬ

                          ΨϮϬϬ

                          ΨϭϬϬ

                            ΨͲ
                                    ϮϬϮϭ        ϮϬϮϮ        ϮϬϮϯ        ϮϬϮϰ        ϮϬϮϱΎ       ϮϬϮϲΎΎ
                                                                &/^  > z  Z

                                                     *Actual    **Amended Budget

                                              Net operating sales tax or ad valorem revenue
                                                            Population

                                        Warning Trend:  Decreasing net operating revenue per capita
                                             Ad Valorem Tax   Ad Valorem Tax       Sales Tax    General Fund Sales
               Fiscal Year    Population
                                             (General Fund)      per Capita     (General Fund)    Tax per Capita
                  2013          27,080       $18,523,069           $684         $10,536,425           $389
                 2014           27,330       $19,193,801           $702         $12,585,569           $461
                  2015          28,296       $19,149,431           $677         $14,339,915           $507
                 2016           28,868      $20,920,809            $725         $13,480,025           $467
                  2017          29,440       $22,694,444           $771         $13,732,007           $466
                 2018           29,580       $24,028,296           $812          $14,111,661          $477
                 2019           30,010       $25,832,530           $861         $15,104,616           $503
                 2020           31,265       $25,072,864           $802         $15,660,985           $501
                  2021          31,664       $25,926,682           $819         $18,598,638           $587
                 2022           31,770       $26,713,569           $841         $21,047,369           $662
                 2023            31,975      $26,578,947           $831         $22,790,698           $713
                 2024            32,195      $27,190,295           $845         $21,278,207           $661
                  2025*         32,320       $27,911,529           $864          $21,850,509          $676
                   2026**       32,364       $27,675,000           $855         $24,310,000           $751
            122   FY 2027 City of Southlake  |  Budget Book                                                                                                                                           FY 2027 City of Southlake  |  Budget Book   123

