


Page 51 - FY 2026-2027 Adopted Budget Book
P. 51
Comprehensive Fund Overview


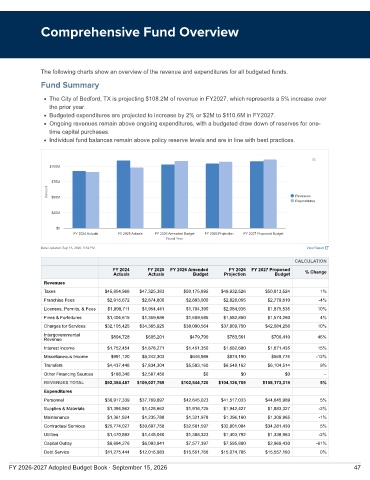
               The following charts show an overview of the revenue and expenditures for all budgeted funds.

               Fund Summary

                 The City of Bedford, TX is projecting $108.2M of revenue in FY2027, which represents a 5% increase over
                 the prior year.
                 Budgeted expenditures are projected to increase by 2% or $2M to $110.6M in FY2027.
                 Ongoing revenues remain above ongoing expenditures, with a budgeted draw down of reserves for one-
                 time capital purchases.
                 Individual fund balances remain above policy reserve levels and are in line with best practices.


                 $100M

                  $75M
                 Amount  $50M                                                                      Revenues

                                                                                                   Expenditures

                  $25M

                    $0
                         FY 2024 Actuals  FY 2025 Actuals  FY 2026 Amended Budget  FY 2026 Projection  FY 2027 Proposed Budget
                                                        Fiscal Year
               Data Updated: Sep 15, 2026, 9:54 PM                                                    View Report
                                                                                                   CALCULATION
                                      FY 2024     FY 2025  FY 2026 Amended   FY 2026  FY 2027 Proposed  % Change
                                       Actuals    Actuals        Budget    Projection       Budget
                Revenues
                Taxes               $45,854,968  $47,325,383  $50,175,895  $49,932,526   $50,813,524       1%
                Franchise Fees       $2,916,672  $2,874,806    $2,893,000  $2,828,055     $2,779,610      -4%
                Licenses, Permits, & Fees  $1,898,711  $1,954,441  $1,704,390  $2,084,935  $1,875,535     10%
                Fines & Forfeitures  $1,404,615  $1,359,686    $1,509,585  $1,582,850     $1,574,260       4%
                Charges for Services  $32,105,425  $34,365,925  $38,090,564  $37,809,750  $42,084,256     10%
                Intergovernmental
                Revenue               $804,728   $605,201       $479,790    $783,561       $700,410       46%
                Interest Income      $1,752,454  $1,878,271    $1,451,350  $1,682,680     $1,671,435      15%
                Miscellaneous Income  $991,120  $8,242,303      $646,986    $874,190       $569,775       -12%
                Transfers            $4,437,448  $7,834,304    $5,593,160  $6,548,162     $6,104,514       9%
                Other Financing Sources  $188,346  $2,587,450       $0           $0            $0           –
                REVENUES TOTAL      $92,354,487  $109,027,769  $102,544,720  $104,126,709  $108,173,319    5%
                Expenditures
                Personnel           $36,917,339  $37,769,897  $42,645,023  $41,517,033   $44,645,969       5%
                Supplies & Materials  $1,394,862  $1,428,662   $1,916,725  $1,942,427     $1,883,327      -2%
                Maintenance          $1,361,824  $1,235,788    $1,321,978  $1,396,160     $1,309,965      -1%
                Contractual Services  $25,774,027  $30,697,758  $32,561,597  $32,801,004  $34,281,430      5%
                Utilities            $1,470,892  $1,448,040    $1,366,323  $1,403,792     $1,338,963      -2%
                Capital Outlay       $6,694,276  $6,093,941    $7,577,397  $7,595,880     $2,969,430      -61%
                Debt Service        $11,275,444  $12,016,983  $15,551,766  $15,074,705   $15,557,193       0%

    FY 2026-2027 Adopted Budget Book · September 15, 2026                                                             47

