
Page 36 - CITY OF WATAUGA, TEXAS ANNUAL BUDGET PORTRAIT
P. 36
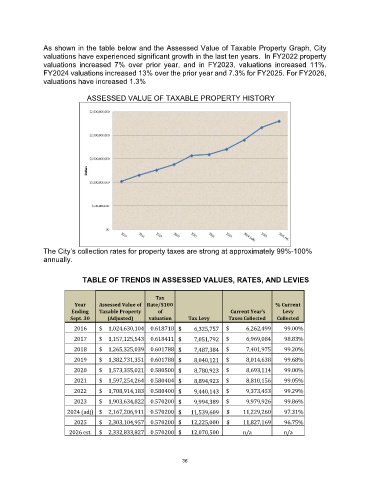
As shown in the table below and the Assessed Value of Taxable Property Graph, City
               valuations have experienced significant growth in the last ten years.  In FY2022 property
               valuations increased  7% over prior  year,  and in FY2023, valuations increased 11%.
               FY2024 valuations increased 13% over the prior year and 7.3% for FY2025. For FY2026,
               valuations have increased 1.3%

                              ASSESSED VALUE OF TAXABLE PROPERTY HISTORY


               The City’s collection rates for property taxes are strong at approximately 99%-100%
               annually.


                            TABLE OF TRENDS IN ASSESSED VALUES, RATES, AND LEVIES


                                                     Tax
                          Year    Assessed Value of  Rate/$100                              % Current
                         Ending   Taxable Property   of                       Current Year's   Levy
                        Sept. 30     (Adjusted)   valuation     Tax Levy     Taxes Collected   Collected

                         2016     $     1,024,630,104  0.618718 $            6,325,757  $              6,262,499   99.00%
                         2017     $     1,157,125,543  0.618411 $            7,051,792  $              6,969,084   98.83%
                         2018     $     1,265,325,039  0.601788 $            7,487,384  $              7,401,975   99.20%
                         2019     $     1,382,731,351  0.601788 $            8,040,121  $              8,014,638   99.68%
                         2020     $     1,573,355,021  0.580500 $            8,780,923  $              8,693,114   99.00%
                         2021     $     1,597,254,264  0.580404 $            8,894,923  $              8,810,156   99.05%
                         2022     $     1,708,914,183  0.580400 $            9,440,143  $              9,373,453   99.29%
                         2023     $     1,903,634,822  0.570200 $            9,994,389  $              9,979,926   99.86%

                       2024 (adj)  $     2,167,206,911  0.570200 $         11,539,609   $           11,229,260   97.31%
                         2025     $     2,303,104,957  0.570200 $         12,225,000   $           11,827,169   96.75%
                        2026 est.   $     2,332,833,827  0.570200 $         12,070,500  n/a    n/a


                                                             36