
Page 129 - CityofSouthlakeFY26AdoptedBudget
P. 129
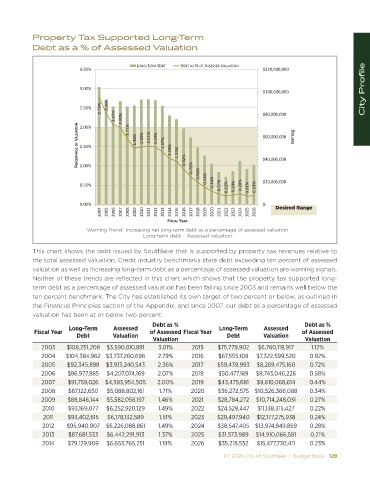
Property Tax Supported Long-Term
            Debt as a % of Assessed Valuation


                                              >KE'Ͳd ZD    d     d  ^ й K&  ^^ ^^   s >h d/KE
                           ϯ͘ϱϬй                                                        ΨϭϮϬ͕ϬϬϬ͕ϬϬϬ


                           ϯ͘ϬϬй
                                                                                        ΨϭϬϬ͕ϬϬϬ͕ϬϬϬ                      City Profile
                                  Ϯ͘ϳϵй
                           Ϯ͘ϱϬй     Ϯ͘ϯϲй
                                       Ϯ͘Ϭϳй  Ϯ͘ϬϬй  ϭ͘ϳϭй                              ΨϴϬ͕ϬϬϬ͕ϬϬϬ
                           W Z  Ed '  K& s >h d/KE  ϭ͘ϱϬй  ϭ͘ϰϲй  ϭ͘ϰϵй  ϭ͘ϱϭй  ϭ͘ϰϵй  ϭ͘ϯϳй  ϭ͘ϭϵй  ϭ͘ϭϮй  ΨϲϬ͕ϬϬϬ͕ϬϬϬ    K>> Z^
                           Ϯ͘ϬϬй


                           ϭ͘ϬϬй
                                                                 Ϭ͘ϳϮй Ϭ͘ϵϮй  Ϭ͘ϱϴй     ΨϰϬ͕ϬϬϬ͕ϬϬϬ

                           Ϭ͘ϱϬй                                     Ϭ͘ϰϰй  Ϭ͘ϯϰй  Ϭ͘Ϯϳй  Ϭ͘ϮϮй  Ϭ͘Ϯϰй  Ϭ͘Ϯϴй  Ϭ͘Ϯϭй  Ϭ͘Ϯϯй  ΨϮϬ͕ϬϬϬ͕ϬϬϬ


                           Ϭ͘ϬϬй                                                        ΨͲ  Desired Range
                                  ϮϬϬϰ  ϮϬϬϱ  ϮϬϬϲ  ϮϬϬϳ  ϮϬϬϴ  ϮϬϬϵ  ϮϬϭϬ  ϮϬϭϭ  ϮϬϭϮ  ϮϬϭϯ  ϮϬϭϰ  ϮϬϭϱ  ϮϬϭϲ  ϮϬϭϳ  ϮϬϭϴ  ϮϬϭϵ  ϮϬϮϬ  ϮϬϮϭ  ϮϬϮϮ  ϮϬϮϯ  ϮϬϮϰ  ϮϬϮϱ  ϮϬϮϲ
                                                        &/^  > z  Z
                              Warning Trend:  Increasing net long-term debt as a percentage of assessed valuation
                                                Long-term debt    Assessed valuation

            This chart shows the debt issued by Southlake that is supported by property tax revenues relative to
            the total assessed valuation. Credit industry benchmarks state debt exceeding ten percent of assessed
            valuation as well as increasing long-term debt as a percentage of assessed valuation are warning signals.
            Neither of these trends are reflected in this chart which shows that the property tax supported long-
            term debt as a percentage of assessed valuation has been falling since 2003 and remains well below the
            ten percent benchmark. The City has established its own target of two percent or below, as outlined in
            the Financial Principles section of the Appendix, and since 2007, our debt as a percentage of assessed
            valuation has been at or below two percent.
                                                   Debt as %                                          Debt as %
                        Long-Term      Assessed                           Long-Term     Assessed
            Fiscal Year                            of Assessed Fiscal Year                           of Assessed
                          Debt        Valuation                             Debt        Valuation
                                                    Valuation                                         Valuation
               2003    $108,251,208  $3,590,810,881  3.01%      2015     $75,779,902  $6,760,119,917    1.12%
               2004    $104,384,962 $3,737,260,696   2.79%      2016     $67,555,109  $7,322,599,520   0.92%
               2005    $92,345,898  $3,913,240,543   2.36%      2017     $59,439,993  $8,269,475,160    0.72%
               2006    $86,977,885  $4,207,074,169   2.07%      2018     $50,477,189  $8,743,046,226   0.58%
               2007    $91,759,026  $4,593,954,505   2.00%      2019     $43,475,681  $9,810,068,614   0.44%
               2008     $87,122,650  $5,088,802,161   1.71%     2020     $36,272,575 $10,526,366,088   0.34%
               2009    $88,846,144  $5,582,058,197   1.46%      2021     $28,784,272  $10,714,248,031   0.27%
               2010     $93,169,077  $6,252,920,129  1.49%      2022     $24,528,447  $11,138,315,427   0.22%
               2011    $93,402,615   $6,178,132,589   1.51%     2023     $29,497,940  $12,177,275,938  0.24%
               2012    $95,940,907  $6,226,088,861   1.49%      2024     $38,547,405 $13,974,849,859   0.28%
               2013     $87,681,533  $6,442,291,913   1.37%     2025     $31,573,989  $14,910,066,581   0.21%
               2014    $79,129,909  $6,653,765,251    1.19%     2026     $35,218,552  $15,477,730,411   0.23%
                                                                           FY 2026 City of Southlake  |  Budget Book   129