
Page 76 - BudgetBookCover_FY26_Adopted.pdf
P. 76
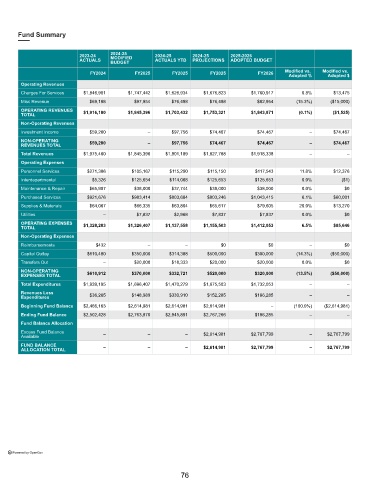
Fund Summary


                                      2024-25
                           2023-24    MODIFIED      2024-25      2024-25     2025-2026
                           ACTUALS    BUDGET        ACTUALS YTD  PROJECTIONS  ADOPTED BUDGET
                                                                                               Modified vs.   Modified vs.
                               FY2024         FY2025      FY2025       FY2025         FY2026
                                                                                                 Adopted %   Adopted $
        Operating Revenues
        Charges For Services  $1,846,981   $1,747,442   $1,626,934  $1,676,823      $1,760,917       0.8%      $13,475
        Misc Revenue           $69,198       $97,954      $76,498     $76,498         $82,954      (15.3%)    ($15,000)
        OPERATING REVENUES   $1,916,180    $1,845,396   $1,703,432  $1,753,321      $1,843,871      (0.1%)     ($1,525)
        TOTAL
        Non-Operating Revenues
        Investment Income      $59,280            –       $97,756     $74,467         $74,467          –       $74,467
        NON-OPERATING          $59,280            –       $97,756     $74,467         $74,467          –       $74,467
        REVENUES TOTAL
        Total Revenues       $1,975,460    $1,845,396   $1,801,189  $1,827,788      $1,918,338         –            –
        Operating Expenses
        Personnel Services    $271,306       $105,167    $115,290     $115,150       $117,543       11.8%      $12,376
        Interdepartmental       $5,326       $125,654    $114,068     $125,653       $125,653        0.0%         ($1)
        Maintenance & Repair   $65,907       $38,000      $37,744     $38,000         $38,000        0.0%          $0
        Purchased Services    $921,676       $983,414    $803,684     $803,246      $1,043,415       6.1%      $60,001
        Supplies & Materials   $64,067       $66,335      $63,804     $65,617         $79,605       20.0%      $13,270
        Utilities                  –          $7,837       $2,968      $7,837          $7,837        0.0%          $0
        OPERATING EXPENSES   $1,328,283    $1,326,407   $1,137,558  $1,155,503      $1,412,053       6.5%      $85,646
        TOTAL
        Non-Operating Expenses
        Reimbursements           $432             –           –           $0              $0           –           $0
        Capital Outlay        $610,480       $350,000    $314,388     $500,000       $300,000      (14.3%)    ($50,000)
        Transfers Out              –         $20,000      $18,333     $20,000         $20,000        0.0%          $0
        NON-OPERATING
        EXPENSES TOTAL        $610,912       $370,000    $332,721     $520,000       $320,000      (13.5%)    ($50,000)
        Total Expenditures   $1,939,195    $1,696,407   $1,470,279  $1,675,503      $1,732,053         –            –
        Revenues Less
        Expenditures           $36,265       $148,989    $330,910     $152,285       $186,285          –            –
        Beginning Fund Balance  $2,466,163  $2,614,981  $2,614,981  $2,614,981             –      (100.0%)  ($2,614,981)
        Ending Fund Balance  $2,502,428    $2,763,970   $2,945,891  $2,767,266       $186,285          –            –
        Fund Balance Allocation
        Excess Fund Balance        –              –           –     $2,614,981      $2,767,799         –     $2,767,799
        Available
        FUND BALANCE               –              –           –     $2,614,981      $2,767,799         –     $2,767,799
        ALLOCATION TOTAL


     Powered by OpenGov


                                                             76