
Page 180 - BudgetBookCover_FY26_Adopted.pdf
P. 180
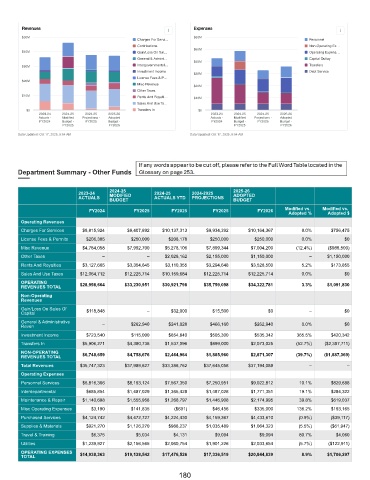
Revenues                                                 Expenses
        $50M                                                     $60M
                                              Charges For Servi…                                       Personnel
                                              Contributions                                            Non-Operating Ex…
                                                                 $50M
        $40M                                  Gain/Loss On Sal…                                        Operating Expens…
                                              General & Admini…                                        Capital Outlay
                                                                 $40M
        $30M                                  Intergovernmental…                                       Transfers
                                              Investment Income                                        Debt Service
                                                                 $30M
                                              License Fees & P…
        $20M
                                              Misc Revenue
                                                                 $20M
                                              Other Taxes
        $10M                                  Rents And Royalti…  $10M
                                              Sales And Use Ta…
          $0                                  Transfers In         $0
              2023-24  2024-25  2024-25  2025-26                       2023-24  2024-25  2024-25  2025-26
                Actuals -    Modified    Projections -    Adopted        Actuals -    Modified    Projections -    Adopted
                FY2024    Budget -    FY2025    Budget -                 FY2024    Budget -    FY2025    Budget -
                        FY2025         FY2026                                    FY2025         FY2026
       Data Updated: Oct 17, 2025, 5:54 AM                      Data Updated: Oct 17, 2025, 5:54 AM


       Department Summary - Other Funds


                                     2024-25                                  2025-26
                           2023-24   MODIFIED       2024-25      2024-2025    ADOPTED
                           ACTUALS   BUDGET         ACTUALS YTD  PROJECTIONS  BUDGET
                                                                                               Modified vs.   Modified vs.
                               FY2024        FY2025       FY2025       FY2025         FY2026
                                                                                                Adopted %    Adopted $
        Operating Revenues
        Charges For Services  $8,815,924   $9,407,892  $10,137,313   $9,934,392    $10,164,367       8.0%      $756,475
        License Fees & Permits  $206,305    $250,000     $208,178     $250,000       $250,000        0.0%          $0
        Misc Revenue        $4,784,058     $7,992,700   $5,278,106   $7,899,344     $7,004,200     (12.4%)    ($988,500)
        Other Taxes                –              –     $2,028,162   $2,155,000     $1,150,000         –     $1,150,000
        Rents And Royalties  $3,127,665    $3,354,645   $3,110,355   $3,294,648     $3,528,500       5.2%      $173,855
        Sales And Use Taxes  $12,064,712  $12,225,714  $10,159,684  $12,225,714    $12,225,714       0.0%          $0
        OPERATING          $28,998,664    $33,230,951  $30,921,798  $35,759,098    $34,322,781       3.3%    $1,091,830
        REVENUES TOTAL
        Non-Operating
        Revenues
        Gain/Loss On Sales Of
        Capital               $118,848            –       $32,000      $15,500            $0           –           $0
        General & Administrative   –        $262,940     $241,028     $466,160       $262,940        0.0%          $0
        Reven
        Investment Income     $723,540      $115,000     $654,840     $505,300       $535,342      365.5%      $420,342
        Transfers In        $5,906,271     $4,380,736   $1,537,096    $899,000      $2,073,025     (52.7%)  ($2,307,711)
        NON-OPERATING
        REVENUES TOTAL      $6,748,659     $4,758,676   $2,464,964   $1,885,960     $2,871,307     (39.7%)  ($1,887,369)
        Total Revenues     $35,747,323    $37,989,627  $33,386,762  $37,645,058    $37,194,088         –            –
        Operating Expenses
        Personnel Services  $6,816,306     $8,193,124   $7,567,350   $7,250,951     $9,022,812      10.1%      $829,688
        Interdepartmental     $685,854     $1,487,029   $1,365,428   $1,487,028     $1,771,351      19.1%      $284,322
        Maintenance & Repair  $1,140,698   $1,555,958   $1,266,797   $1,446,908     $2,174,995      39.8%      $619,037
        Misc Operating Expenses  $3,190     $141,835       ($601)      $46,456       $335,000      136.2%      $193,165
        Purchased Services  $4,124,742     $4,472,727   $4,224,430   $4,159,367     $4,433,610      (0.9%)    ($39,117)
        Supplies & Materials  $921,270     $1,126,270    $988,237    $1,035,489     $1,064,323      (5.5%)    ($61,947)
        Travel & Training      $6,375         $5,034      $4,131        $9,094         $9,094       80.7%       $4,060
        Utilities           $1,239,927     $2,156,565   $2,060,754   $1,901,226     $2,033,654      (5.7%)    ($122,911)
        OPERATING EXPENSES   $14,938,363  $19,138,542  $17,476,526  $17,336,519    $20,844,839       8.9%    $1,706,297
        TOTAL

                                                            180