
Page 179 - BudgetBookCover_FY26_Adopted.pdf
P. 179
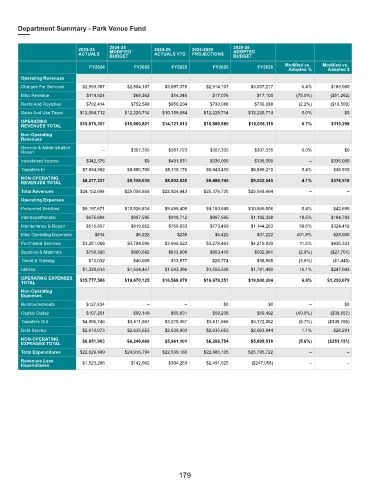
Department Summary - Park Venue Fund


                                     2024-25                                  2025-26
                           2023-24   MODIFIED       2024-25      2024-2025    ADOPTED
                           ACTUALS   BUDGET         ACTUALS YTD  PROJECTIONS  BUDGET
                               FY2024        FY2025       FY2025       FY2025         FY2026   Modified vs.   Modified vs.
                                                                                                Adopted %    Adopted $
        Operating Revenues
        Charges For Services  $2,993,307   $2,854,157   $3,097,379   $2,914,107     $3,037,217       6.4%      $183,060
        Misc Revenue          $114,924       $68,362      $14,346      $17,076        $17,100      (75.0%)    ($51,262)
        Rents And Royalties   $702,414      $752,588     $850,204     $733,088       $736,088       (2.2%)    ($16,500)
        Sales And Use Taxes  $12,064,712  $12,225,714  $10,159,684  $12,225,714    $12,225,714       0.0%          $0
        OPERATING
        REVENUES TOTAL     $15,875,357    $15,900,821  $14,121,613  $15,889,985    $16,016,119       0.7%      $115,298
        Non-Operating
        Revenues
        General & Administrative   –        $307,335     $281,723     $307,335       $307,335        0.0%          $0
        Reven
        Investment Income     $342,376           $0      $401,931     $336,000       $336,000          –       $336,000
        Transfers In        $7,934,962     $8,850,700   $8,119,176   $8,843,410     $8,889,210       0.4%      $38,510
        NON-OPERATING       $8,277,337     $9,158,035   $8,802,830   $9,486,745     $9,532,545       4.1%      $374,510
        REVENUES TOTAL
        Total Revenues     $24,152,694    $25,058,856  $22,924,443  $25,376,730    $25,548,664         –            –
        Operating Expenses
        Personnel Services  $9,197,671    $10,526,816   $9,489,405   $9,183,645    $10,569,506       0.4%      $42,690
        Interdepartmental     $675,604      $997,595     $910,712     $997,595      $1,182,338      18.5%      $184,743
        Maintenance & Repair  $510,857      $819,852     $750,933     $773,499      $1,144,263      39.6%      $324,412
        Misc Operating Expenses  $814         $6,222        $235        $6,422        $31,222      401.8%      $25,000
        Purchased Services  $3,281,068     $3,784,506   $3,046,623   $3,279,463     $4,219,839      11.5%      $435,333
        Supplies & Materials  $758,926      $960,682     $813,808     $853,415       $932,981       (2.9%)    ($27,701)
        Travel & Training     $13,032        $40,005      $13,977      $28,774        $38,565       (3.6%)     ($1,440)
        Utilities           $1,339,613     $1,534,447   $1,543,386   $1,555,538     $1,781,490      16.1%      $247,043
        OPERATING EXPENSES   $15,777,586  $18,670,125  $16,569,079  $16,678,351    $19,900,204       6.6%    $1,230,079
        TOTAL
        Non-Operating
        Expenses
        Reimbursements        $127,834            –           –            $0             $0           –           $0
        Capital Outlay        $107,251       $99,149      $50,831      $59,235        $59,492      (40.0%)    ($39,657)
        Transfers Out       $4,006,746     $3,511,867   $3,270,367   $3,511,866     $3,172,082      (9.7%)    ($339,785)
        Debt Service        $2,610,073     $2,635,653   $2,639,903   $2,635,653     $2,663,944       1.1%      $28,291
        NON-OPERATING
        EXPENSES TOTAL      $6,851,903     $6,246,669   $5,961,101   $6,206,754     $5,895,518      (5.6%)    ($351,151)
        Total Expenditures  $22,629,489   $24,916,794  $22,530,180  $22,885,105    $25,795,722         –            –
        Revenues Less       $1,523,206      $142,062     $394,263    $2,491,625     ($247,058)         –            –
        Expenditures


                                                            179