
Page 31 - CityofEulessFY26AdoptedBudgetOrdinance2432
P. 31
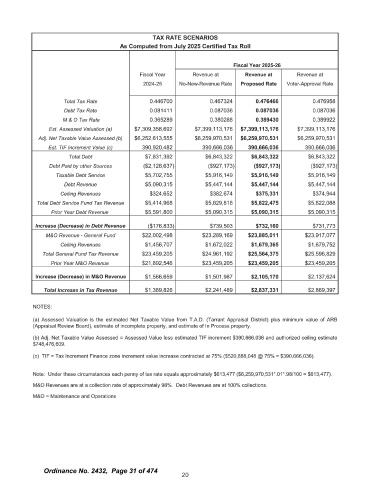
TAX  RATE  SCENARIOS
                                         As Computed  from July 2025 Certified Tax Roll

                                                                              Fiscal Year 2025- 26
                                               Fiscal  Year      Revenue  at      Revenue  at      Revenue at
                                                2024- 25    No -New -Revenue Rate  Proposed Rate  Voter -Approval Rate


                      Total Tax Rate               0. 446700          0. 467324       0. 476466         0. 476958
                      Debt Tax Rate                0. 081411          0. 087036       0. 087036         0. 087036
                      M &  0 Tax Rate              0. 365289          0. 380288       0. 389430         0. 389922
                 Est. Assessed Valuation ( a)   7, 309, 358, 692  7, 399, 113, 176  7, 399, 113, 176  7, 399, 113, 176
              Adj.  Net Taxable Value Assessed ( b)   6, 252, 613, 555  6, 259, 970, 531  6, 259, 970, 531  6, 259, 970, 531
                 Est.  TIF Increment Value ( c)   390, 920, 482     390, 666, 036  390, 666, 036      390, 666, 036
                        Total Debt                7, 831, 392         6, 843, 322    6, 843, 322        6, 843, 322
                 Debt Paid by other Sources       2, 128, 637)         927, 173)       927, 173)         927, 173)
                    Taxable Debt Service          5, 702, 755         5, 916, 149    5, 916, 149        5, 916, 149
                      Debt Revenue                5, 090, 315         5, 447, 144    5, 447, 144        5, 447, 144
                     Ceiling Revenues               324, 652           382, 674        375, 331          374, 944
             Total Debt Service Fund Tax Revenue  5, 414, 968         5, 829, 818    5, 822, 475        5, 822, 088
                  Prior Year Debt Revenue         5, 591, 800         5, 090, 315    5, 090, 315        5, 090, 315
             Increase ( Decrease)  in Debt Revenue  176, 833)          739, 503        732, 160          731, 773
                M& O Revenue -  General Fund     22, 002, 498        23, 289, 169   23, 885, 011       23, 917, 077
                     Ceiling Revenues             1, 456, 707         1, 672, 022    1, 679, 365        1, 679, 752
               Total General Fund Tax Revenue    23, 459, 205        24, 961, 192   25, 564, 375       25, 596, 829
                  Prior Year M& O Revenue        21, 892, 546        23, 459, 205   23, 459, 205       23, 459, 205

             Increase ( Decrease)  in M& O Revenue  1,  566, 659      1, 501, 987 $  2, 105, 170        2, 137, 624

                Total Increase in Tax Revenue     1, 389, 826         2, 241, 489 $  2, 837, 331        2, 869, 397

            NOTES:

            a)  Assessed  Valuation  is the estimated  Net Taxable  Value from T. A. D. ( Tarrant Appraisal  District)  plus minimum  value of ARB
            Appraisal Review Board),  estimate of incomplete property,  and estimate of In Process property.

            b)  Adj.  Net Taxable Value Assessed =  Assessed  Value less estimated TIF increment $ 390, 666, 036 and authorized  ceiling estimate
             748, 476, 609.
            c)  TIF =  Tax Increment Finance zone increment value increase contracted at 75% ($ 520, 888, 048 @ 75% = $  390, 666, 036).


            Note:  Under these circumstances  each penny of tax rate equals approximately $ 613, 477 ($ 6, 259,970, 531*. 01*. 98/ 100 = $ 613,477).
            M& O Revenues are at a collection rate of approximately 98%.  Debt Revenues are at 100%  collections.

            M& O =  Maintenance and Operations


                Ordinance No.  2432,  Page 31 of 474
                                                             20