
Page 9 - Bedford-FY25-26 Budget
P. 9
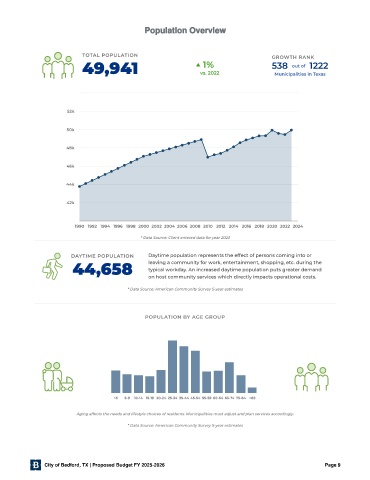
Population Overview


                            T OTA L   P O P U L AT I O N
                                                                                           G R OWT H   R A N K
                            49,941                                  1%                     538    out of  1222
                                                                   vs. 2022
                                                                                            Municipalities in Texas


                       52k


                       50k


                       48k

                       46k


                       44k


                       42k


                          1990  1992  1994  1996  1998  2000  2002  2004  2006  2008  2010  2012  2014  2016  2018  2020  2022  2024
                                               * Data Source: Client entered data for year 2023


                                                  Daytime population represents the effect of persons coming into or
                        DAY T I M  E   P O P U L AT I O N
                                                  leaving a community for work, entertainment, shopping, etc. during the
                         44,658                   typical workday. An increased daytime population puts greater demand
                                                  on host community services which directly impacts operational costs.

                                           * Data Source: American Community Survey 5-year estimates


                                                 P O P U L AT I O N   BY   A G E   G R O U P


                                       <5  5-9  10-14  15-19  20-24  25-34  35-44  45-54  55-59  60-64  65-74  75-84  >85


                          Aging affects the needs and lifestyle choices of residents. Municipalities must adjust and plan services accordingly.
                                           * Data Source: American Community Survey 5-year estimates


                City of Bedford, TX | Proposed Budget FY 2025-2026                                           Page 9