Page 339 - Bedford-FY25-26 Budget
P. 339

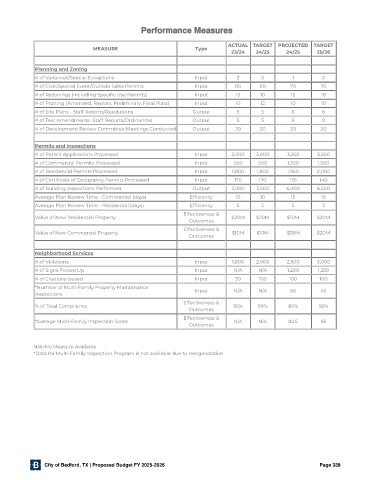
Performance Measures


                                                                            ACTUAL   TARGET  PROJECTED   TARGET
                                MEASURE                           Type
                                                                              23/24   24/25     24/25     25/26


             Planning and Zoning
             # of Variances/Special Exceptions                   Input         2        3         1         0
             # of Civic/Special Event/Outside Sales Permits      Input         80      80        70        70
             # of Rezonings (Including Speci c Use Permits)      Input         15      10        15        10
             # of Platting (Amended, Replats, Preliminary, Final Plats)  Input  10     12        10        10
             # of Site Plans - Staff Reports/Resolutions         Output        5       5          8         6
             # of Text Amendments -Staff Reports/Ordinances      Output        5       5          6         0
             # of Development Review Committee Meetings Conducted  Output      20      20        20        20


             Permits and Inspections
             # of Permit Applications Processed                  Input        3,000   3,000     3,250     3,500
             # of Commercial Permits Processed                   Input        550     500       1,300     1,500
             # of Residential Permits Processed                  Input        1,800   1,800     1,950     2,000
             # of Certi cate of Occupancy Permits Processed      Input         170     170       135       140
             # of Building Inspections Performed                 Output       3,000   3,500     6,000     6,500
             Average Plan Review Time - Commercial (days)       Ef ciency      10      10        15        10
             Average Plan Review Time - Residential (days)      Ef ciency      5       5          5         3
                                                              Effectiveness &
             Value of New Residential Property                                $20M    $20M      $10M      $20M
                                                                Outcomes
                                                              Effectiveness &
             Value of New Commercial Property                                 $10M    $10M      $38M      $20M
                                                                Outcomes


             Neighborhood Services
             # of Violations                                     Input        1,800   2,000     2,600     3,000
             # of Signs Picked Up                                Input        N/A      N/A      1,200     1,250
             # of Citations Issued                               Input         50      100       100       100
             *Number of Multi-Family Property Maintenance
             Inspections                                         Input        N/A      N/A       60        45
                                                              Effectiveness &
             % of Total Compliance                                            95%     99%       85%       95%
                                                                Outcomes
                                                              Effectiveness &
             *Average Multi-Family Inspection Score                           N/A      N/A      82.5       85
                                                                Outcomes


            N/A=No Measure Available
            *Data for Multi-Family Inspection Program is not available due to reorganization


                City of Bedford, TX | Proposed Budget FY 2025-2026                                         Page 339
   334   335   336   337   338   339   340   341   342   343   344