
Page 8 - CityofArlingtonFY26AdoptedBudget
P. 8
Budget In Brief
FY 2026 PROPOSED GENERAL FUND REVENUES
As in recent years, the City’s revenue outlook continues to follow a growth trend, speaking of revenues in the aggregate. Going
into FY 2025, the City had seen multiple years of above-average increases coming out of the COVID-19 pandemic, and growth
appeared to have settled back to rates that were more in line with pre-pandemic growth. However, the City’s two largest
revenues, sales tax and property tax, have not performed as well as expected in the current year. Sales tax revenue is expected
to come in well below budget in FY 2025, but with major events being hosted in the City during FY 2026, including multiple FIFA
World Cup soccer matches and the INDYCAR Grand Prix of Arlington, sales tax revenue is expected to grow by 3.28% over the
year-end estimate for FY 2025, with the FY 2026 budget set at $93.8 million. Growth in property values has leveled off during
the past year. Property values continue to grow heading into FY 2026, but at less than half of the rate of growth for FY 2025.
For FY 2026, assessed property values increased by 1.9% from last year. The following table provides a summary of General
Fund revenues by major category for FY 2024 Actuals, FY 2025 Budget & Estimates, and FY 2026 Proposed revenues.
FY 2024 Actuals FY 2025 Budget FY 2025 Estimated FY 2026 Proposed
Property Taxes $ 140,344,589 $ 152,001,691 $ 148,480,530 $ 158,667,258
Sales Taxes 91,385,703 97,249,802 90,806,669 93,785,128
Franchise Fees 33,230,608 33,601,658 34,218,321 35,340,680
Service Charges 8,540,276 10,270,373 13,040,865 11,553,941
Fines and Forfeitures 6,304,725 5,634,071 7,847,856 7,539,359
Other Revenues 34,544,074 37,977,641 36,438,475 40,841,967
Total Revenues $ 314,349,975 $ 336,735,236 $ 330,832,716 $ 347,728,333
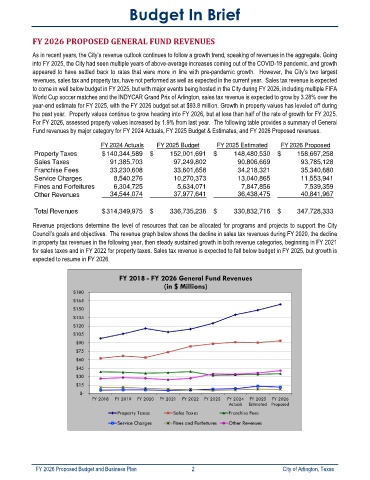
Revenue projections determine the level of resources that can be allocated for programs and projects to support the City
Council’s goals and objectives. The revenue graph below shows the decline in sales tax revenues during FY 2020, the decline
in property tax revenues in the following year, then steady sustained growth in both revenue categories, beginning in FY 2021
for sales taxes and in FY 2022 for property taxes. Sales tax revenue is expected to fall below budget in FY 2025, but growth is
expected to resume in FY 2026.
FY 2026 Proposed Budget and Business Plan 2 City of Arlington, Texas