
Page 198 - CityofArlingtonFY26AdoptedBudget
P. 198
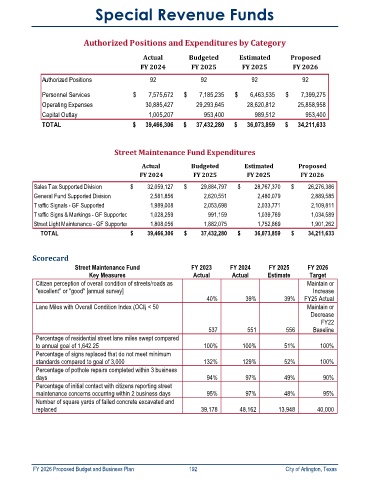
Special Revenue Funds


                             Authorized Positions and Expenditures by Category

                                                Actual          Budgeted        Estimated        Proposed
                                               FY 2024          FY 2025          FY 2025          FY 2026

               Authorized Positions                92              92               92               92

               Personnel Services            $           7,575,672  $           7,185,235  $           6,463,535  $           7,399,275
               Operating Expenses                       30,885,427             29,293,645             28,620,812             25,858,958
               Capital Outlay                             1,005,207                   953,400                   989,512                   953,400
               TOTAL                         $         39,466,306  $         37,432,280  $         36,073,859  $         34,211,633


                                       Street Maintenance Fund Expenditures


                                                Actual          Budgeted          Estimated         Proposed
                                               FY 2024           FY 2025           FY 2025          FY 2026

            Sales Tax Supported Division    $             32,059,127  $             29,884,797  $             28,767,370  $             26,276,386
            General Fund Supported Division                    2,581,856                    2,620,551                    2,480,079                    2,889,585
            Traffic Signals - GF Supported                    1,989,008                    2,053,698                    2,033,771                    2,109,811
            Traffic Signs & Markings - GF Supported                   1,028,259                       991,159                    1,039,769                    1,034,589
            Street Light Maintenance - GF Supported                   1,808,056                    1,882,075                    1,752,869                    1,901,262
                 TOTAL                      $             39,466,306  $             37,432,280  $             36,073,859  $             34,211,633


            Scorecard
                          Street Maintenance Fund               FY 2023      FY 2024      FY 2025      FY 2026
                              Key Measures                       Actual       Actual      Estimate     Target
             Citizen perception of overall condition of streets/roads as                               Maintain or
             "excellent" or "good" [annual survey]                                                       Increase
                                                                     40%          39%          39%    FY25 Actual
             Lane Miles with Overall Condition Index (OCI) < 50                                        Maintain or
                                                                                                        Decrease
                                                                                                           FY22
                                                                      537          551          556      Baseline
             Percentage of residential street lane miles swept compared
             to annual goal of 1,642.25                             100%         100%          51%         100%
             Percentage of signs replaced that do not meet minimum
             standards compared to goal of 3,000                    132%         129%          52%         100%
             Percentage of pothole repairs completed within 3 business
             days                                                    94%          97%          49%          90%
             Percentage of initial contact with citizens reporting street
             maintenance concerns occurring within 2 business days   95%          97%          48%          95%
             Number of square yards of failed concrete excavated and
             replaced                                               39,178      48,162       13,948       40,000


            FY 2026 Proposed Budget and Business Plan                                        192                                                                City of Arlington, Texas