
Page 186 - CityofArlingtonFY26AdoptedBudget
P. 186
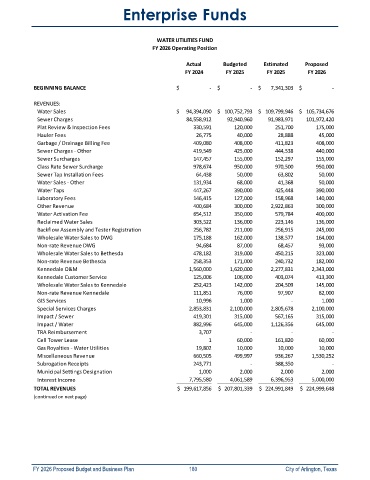
Enterprise Funds


                                                     WATER UTILITIES FUND
                                                   FY 2026 Operating Position


                                                               Actual      Budgeted     Estimated     Proposed
                                                              FY 2024       FY 2025      FY 2025       FY 2026


            BEGINNING BALANCE                              $                           -  $                           -  $          7,341,303 $                           -

            REVENUES:
             Water Sales                                   $        94,394,090 $     100,752,793 $     109,799,946 $     105,734,676
             Sewer Charges                                           84,558,912           92,940,960           91,983,971         101,972,420
             Plat Review & Inspection Fees                                 330,591                 120,000                 251,700                 175,000
             Hauler Fees                                                     26,775                   40,000                   28,888                   45,000
             Garbage / Drainage Billing Fee                                409,080                 408,000                 411,823                 408,000
             Sewer Charges - Other                                         419,549                 425,000                 444,538                 440,000
             Sewer Surcharges                                              147,457                 155,000                 152,297                 155,000
             Class Rate Sewer Surcharge                                    978,674                 950,000                 970,500                 950,000
             Sewer Tap Installation Fees                                     64,438                   50,000                   63,802                   50,000
             Water Sales - Other                                           131,934                   68,000                   41,368                   50,000
             Water Taps                                                    447,267                 390,000                 425,448                 390,000
             Laboratory Fees                                               146,415                 127,000                 158,968                 140,000
             Other Revenue                                                 400,684                 300,000             2,922,863                 300,000
             Water Activation Fee                                          654,512                 350,000                 579,784                 400,000
             Reclaimed Water Sales                                         303,522                 136,000                 223,146                 136,000
             Backflow Assembly and Tester Registration                     256,782                 211,000                 256,915                 245,000
             Wholesale Water Sales to DWG                                  175,188                 162,000                 138,577                 164,000
             Non-rate Revenue DWG                                            94,684                   87,000                   68,457                   93,000
             Wholesale Water Sales to Bethesda                             478,182                 319,000                 450,215                 323,000
             Non-rate Revenue Bethesda                                     258,353                 171,000                 240,732                 182,000
             Kennedale O&M                                             1,560,000             1,620,000             2,277,831             2,343,000
             Kennedale Customer Service                                    125,006                 106,000                 403,074                 413,300
             Wholesale Water Sales to Kennedale                            252,423                 142,000                 204,509                 145,000
             Non-rate Revenue Kennedale                                    111,851                   76,000                   97,907                   82,000
             GIS Services                                                    10,996                      1,000                               -                       1,000
             Special Services Charges                                  2,853,831             2,100,000             2,805,678             2,100,000
             Impact / Sewer                                                419,301                 315,000                 567,165                 315,000
             Impact / Water                                                882,996                 645,000             1,126,356                 645,000
             TRA Reimbursement                                                  3,707                               -                                -                                -
             Cell Tower Lease                                                           1                   60,000                 161,820                   60,000
             Gas Royalties - Water Utilities                                 19,802                   10,000                   10,000                   10,000
             Miscellaneous Revenue                                         660,505                 499,997                 936,267             1,530,252
             Subrogation Receipts                                          243,771                               -                  388,350                               -
             Municipal Settings Designation                                     1,000                      2,000                      2,000                      2,000
             Interest Income                                           7,795,580             4,061,589             6,396,953             5,000,000
            TOTAL REVENUES                                  $     199,617,856  $     207,801,339  $     224,991,849  $     224,999,648
            (continued on next page)


            FY 2026 Proposed Budget and Business Plan                                        180                                                                City of Arlington, Texas