
Page 185 - CityofArlingtonFY26AdoptedBudget
P. 185
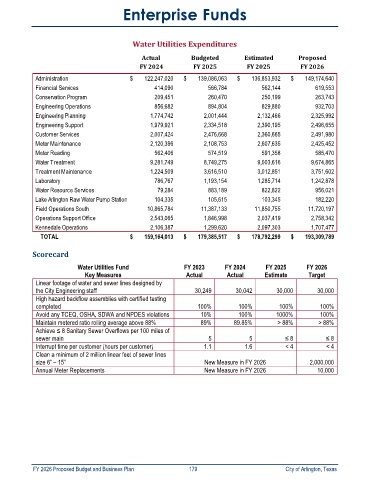
Enterprise Funds


                                             Water Utilities Expenditures

                                                Actual          Budgeted          Estimated         Proposed
                                               FY 2024           FY 2025           FY 2025          FY 2026
             Administration                 $           122,247,020  $           139,086,063  $           136,853,932  $           149,174,640
             Financial Services                                  414,090                       566,784                       562,144                       619,553
             Conservation Program                                209,451                       260,470                       250,199                       263,743
             Engineering Operations                              856,682                       894,804                       829,880                       932,703
             Engineering Planning                             1,774,742                    2,001,444                    2,132,466                    2,325,992
             Engineering Support                              1,979,921                    2,334,518                    2,390,195                    2,496,655
             Customer Services                                2,007,424                    2,476,668                    2,360,665                    2,491,980
             Meter Maintenance                                2,120,396                    2,108,753                    2,607,635                    2,425,452
             Meter Reading                                       562,406                       574,519                       591,358                       585,470
             Water Treatment                                  9,281,749                    8,749,275                    9,003,616                    9,674,865
             Treatment Maintenance                            1,224,509                    3,616,510                    3,012,851                    3,751,602
             Laboratory                                          786,767                    1,193,154                    1,285,714                    1,242,878
             Water Resource Services                                79,284                       883,189                       822,822                       956,021
             Lake Arlington Raw Water Pump Station                      104,335                       105,615                       103,345                       182,220
             Field Operations South                         10,865,784                  11,387,133                  11,850,755                  11,720,197
             Operations Support Office                        2,543,065                    1,846,998                    2,037,419                    2,758,342
             Kennedale Operations                             2,106,387                    1,299,620                    2,097,303                    1,707,477
                 TOTAL                      $           159,164,013  $           179,385,517  $           178,792,299  $           193,309,789


            Scorecard
                           Water Utilities Fund               FY 2023      FY 2024       FY 2025      FY 2026
                             Key Measures                      Actual       Actual       Estimate      Target
             Linear footage of water and sewer lines designed by
             the City Engineering staff                           30,249       30,042        30,000       30,000
             High hazard backflow assemblies with certified testing
             completed                                            100%          100%         100%          100%
             Avoid any TCEQ, OSHA, SDWA and NPDES violations       10%          100%        1000%          100%
             Maintain metered ratio rolling average above 88%      89%        89.85%         > 88%        > 88%
             Achieve ≤ 8 Sanitary Sewer Overflows per 100 miles of
             sewer main                                               5             5          ≤ 8           ≤ 8
             Interrupt time per customer (hours per customer)        1.1          1.6          < 4           < 4
             Clean a minimum of 2 million linear feet of sewer lines
             size 6” – 15”                                           New Measure in FY 2026            2,000,000
             Annual Meter Replacements                               New Measure in FY 2026               10,000


            FY 2026 Proposed Budget and Business Plan                                        179                                                                City of Arlington, Texas