
Page 89 - CityofMansfieldFY25Budget
P. 89
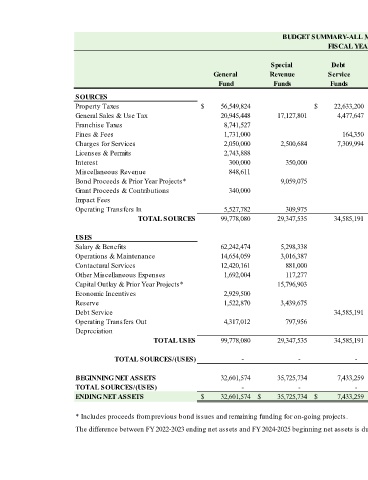
BUDGET SUMMARY-ALL MAJOR FUNDS COMBINED
FISCAL YEAR 2024-2025
2024-2025 2023-2024 2022-2023
Special Debt Capital Budget Budget Actual
General Revenue Service Projects Enterprise All Fund All Fund All Fund
Fund Funds Funds Funds* Funds Types Types Types
SOURCES
Property Taxes $ 56,549,824 $ 22,633,200 $ 79,183,024 $ 73,385,766 $ 69,429,703
General Sales & Use Tax 20,945,448 17,127,801 4,477,647 42,550,896 41,649,288 40,707,475
Franchise Taxes 8,741,527 8,741,527 8,395,334 8,949,636
Fines & Fees 1,731,000 164,350 2,708,173 4,603,523 5,135,853 6,702,149
Charges for Services 2,050,000 2,500,684 7,309,994 42,778,006 54,638,684 52,094,880 49,778,302
Licenses & Permits 2,743,888 2,743,888 2,771,994 3,378,244
Interest 300,000 350,000 125,000 775,000 282,000 8,789,097
Miscellaneous Revenue 848,611 70,000 918,611 834,337 4,984,543
Bond Proceeds & Prior Year Projects* 9,059,075 306,166,855 315,225,930 158,683,286 94,185,222
Grant Proceeds & Contributions 340,000 340,000 300,000 11,889,331
Impact Fees 4,000,000 4,000,000 2,500,000 5,563,853
Operating Transfers In 5,527,782 309,975 2,819,417 8,657,174 9,256,955 9,353,311
TOTAL SOURCES 99,778,080 29,347,535 34,585,191 312,986,272 45,681,179 522,378,257 355,289,693 313,710,865
USES
Salary & Benefits 62,242,474 5,298,338 1,527,041 8,223,149 77,291,002 73,417,249 68,586,960
Operations & Maintenance 14,654,059 3,016,387 28,224,163 45,894,609 41,942,054 42,308,143
Contactural Services 12,420,161 881,000 140,000 1,190,091 14,631,252 12,274,411 14,543,994
Other Miscellaneous Expenses 1,692,004 117,277 458,410 2,267,690 3,095,694 4,064,497
Capital Outlay & Prior Year Projects* 15,796,903 311,319,231 327,116,134 169,761,036 63,092,996
Economic Incentives 2,929,500 2,929,500 1,992,440 3,283,437
Reserve 1,522,870 3,439,675 2,832,272 7,794,816 11,690,183 -
Debt Service 34,585,191 34,585,191 30,756,476 35,388,339
Operating Transfers Out 4,317,012 797,956 4,753,094 9,868,062 10,360,150 7,765,040
Depreciation - - 6,295,820
TOTAL USES 99,778,080 29,347,535 34,585,191 312,986,272 45,681,179 522,378,257 355,289,693 245,329,226
TOTAL SOURCES/(USES) - - - - - - - 68,381,639
BEGINNING NET ASSETS 32,601,574 35,725,734 7,433,259 91,097,188 270,095,200 436,952,955 368,458,716 376,100,009
TOTAL SOURCES/(USES) - - - - - - - 68,381,639
ENDING NET ASSETS $ 32,601,574 $ 35,725,734 $ 7,433,259 $ 91,097,188 $ 270,095,200 $ 436,952,955 $ 368,458,716 $ 444,481,648
* Includes proceeds from previous bond issues and remaining funding for on-going projects.
The difference between FY 2022-2023 ending net assets and FY 2024-2025 beginning net assets is due to other minor governmental funds included in the financial statements but not in the budget.
89