
Page 85 - CityofKellerFY25Budget
P. 85
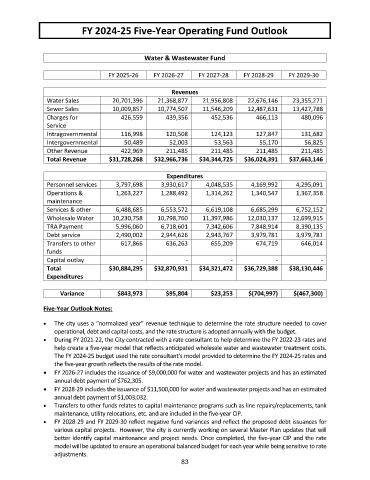
FY 2024-25 Five-Year Operating Fund Outlook
Water & Wastewater Fund
FY 2025-26 FY 2026-27 FY 2027-28 FY 2028-29 FY 2029-30
Revenues
Water Sales 20,701,396 21,368,877 21,956,808 22,676,146 23,355,271
Sewer Sales 10,009,857 10,774,507 11,546,209 12,487,631 13,427,788
Charges for 426,559 439,356 452,536 466,113 480,096
Service
Intragovernmental 116,998 120,508 124,123 127,847 131,682
Intergovernmental 50,489 52,003 53,563 55,170 56,825
Other Revenue 422,969 211,485 211,485 211,485 211,485
Total Revenue $31,728,268 $32,966,736 $34,344,725 $36,024,391 $37,663,146
Expenditures
Personnel services 3,797,698 3,930,617 4,048,535 4,169,992 4,295,091
Operations & 1,263,227 1,288,492 1,314,262 1,340,547 1,367,358
maintenance
Services & other 6,488,685 6,553,572 6,619,108 6,685,299 6,752,152
Wholesale Water 10,230,758 10,798,760 11,397,986 12,030,137 12,699,915
TRA Payment 5,996,060 6,718,601 7,342,606 7,848,914 8,390,135
Debt service 2,490,002 2,944,626 2,943,767 3,979,781 3,979,781
Transfers to other 617,866 636,263 655,209 674,719 646,014
funds
Capital outlay - - - - -
Total $30,884,295 $32,870,931 $34,321,472 $36,729,388 $38,130,446
Expenditures
Variance $843,973 $95,804 $23,253 $(704,997) $(467,300)
Five-Year Outlook Notes:
The city uses a “normalized year” revenue technique to determine the rate structure needed to cover
operational, debt and capital costs, and the rate structure is adopted annually with the budget.
During FY 2021-22, the City contracted with a rate consultant to help determine the FY 2022-23 rates and
help create a five-year model that reflects anticipated wholesale water and wastewater treatment costs.
The FY 2024-25 budget used the rate consultant’s model provided to determine the FY 2024-25 rates and
the five-year growth reflects the results of the rate model.
FY 2026-27 includes the issuance of $9,000,000 for water and wastewater projects and has an estimated
annual debt payment of $762,305.
FY 2028-29 includes the issuance of $11,500,000 for water and wastewater projects and has an estimated
annual debt payment of $1,003,032.
Transfers to other funds relates to capital maintenance programs such as line repairs/replacements, tank
maintenance, utility relocations, etc. and are included in the five-year CIP.
FY 2028-29 and FY 2029-30 reflect negative fund variances and reflect the proposed debt issuances for
various capital projects. However, the city is currently working on several Master Plan updates that will
better identify capital maintenance and project needs. Once completed, the five-year CIP and the rate
model will be updated to ensure an operational balanced budget for each year while being sensitive to rate
adjustments.
83