
Page 91 - HaltomCityFY25Budget
P. 91
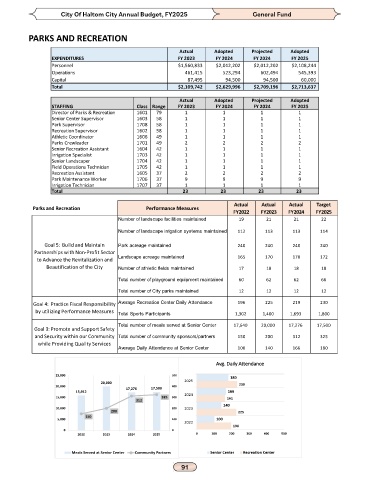
City Of Haltom City Annual Budget, FY2025                       General Fund


          PARKS AND RECREATION


                                                            Actual      Adopted     Projected    Adopted
                  EXPENDITURES                              FY 2023     FY 2024      FY 2024     FY 2025
                  Personnel                                 $1,560,833  $2,012,202   $2,012,202   $2,108,244
                  Operations                                  461,415      523,294     602,494      545,393
                  Capital                                      87,495       94,500      94,500       60,000
                  Total                                     $2,109,742  $2,629,996   $2,709,196   $2,713,637

                                                            Actual      Adopted     Projected    Adopted
                  STAFFING                    Class Range   FY 2023     FY 2024      FY 2024     FY 2025
                  Director of Parks & Recreation  1601  79    1            1           1            1
                  Senior Center Supervisor    1603   58       1            1           1            1
                  Park Supervisor             1708   58       1            1           1            1
                  Recreation Supervisor       1602   58       1            1           1            1
                  Athletic Coordinator        1606   49       1            1           1            1
                  Parks Crewleader            1701   49       2            2           2            2
                  Senior Recreation Assistant  1604  42       1            1           1            1
                  Irrigation Specialist       1703   42       1            1           1            1
                  Senior Landscaper           1704   42       1            1           1            1
                  Field Operations Technician  1705  42       1            1           1            1
                  Recreation Assistant        1605   37       2            2           2            2
                  Park Maintenance Worker     1706   37       9            9           9            9
                  Irrigation Technician       1707   37       1            1           1            1
                  Total                                      23           23           23          23
                                                                              Actual    Actual   Actual   Target
            Parks and Recreation                 Performance Measures
                                                                              FY2022   FY2023   FY2024   FY2025
                                        Number of landscape facilities maintained  19    21       21       22

                                        Number of landscape irrigation systems maintained  112  113  113   114

                Goal 5:  Build and Maintain   Park acreage maintained           240      240      240      240
            Partnerships with Non-Profit Sector
             to Advance the Revitalization and   Landscape acreage maintained   165      170      170      172
                Beautification of the City  Number of athletic fields maintained  17     18       18       18

                                        Total number of playground equipment maintained  60  62   62       66
                                        Total number of City parks maintained   12       12       12       12

            Goal 4:  Practice Fiscal Responsibility   Average Recreation Center Daily Attendance  196  225  219  230
             by utilizing Performance Measures  Total Sports Participants                   1,302  1,400  1,693  1,800

                                        Total number of meals served at Senior Center  17,640  20,000  17,276  17,500
            Goal 3: Promote and Support Safety
             and Security within our Community   Total number of community sponsors/partners  150  200  312  325
              while Providing Quality Services
                                        Average Daily Attendance at Senior Center  100   140      166      180

                                                                        Avg. Daily Attendance

                   25,000                                 500                180
                                  20,000                      2025
                   20,000                  17,276   17,500   400                230
                          15,912                                            166
                   15,000                             325   300  2024       161
                                              312
                                                                           140
                   10,000                                 200  2023
                                      200                                       225
                             150
                    5,000                                 100            100
                                                              2022
                                                                              196
                      0                                   0
                           2022    2023    2024     2025          0    100   200   300  400   500
                         Meals Served at Senior Center  Community Partners  Senior Center  Recreation Center